Insight reports
Activity Audit Log summary
The Activity Audit Log Summary provides a high-level audit log summary capturing the utilization of DCT by displaying user activity and the historical count of actions executed within the platform. This concise report enables stakeholders to quickly identify trends, monitor user engagement, and assess the overall effectiveness of data governance processes.
Block Storage report
This report provides users with a comprehensive view of storage usage across different engines. With this report, users can easily identify the engines that are utilizing the most storage and take necessary action to optimize storage usage.
Central Governance insights
DCT provides global reporting of real-time statuses. This section will break down all of the reports in the Insights section of DCT.
All insight dashboards can be exported to CSV or JSON format.
Compliance Job Executions report
The Compliance Job Executions Report dashboard offers a comprehensive overview of the compliance jobs executed within DCT, by presenting key metrics that enable stakeholders to assess the efficiency and effectiveness of their data governance efforts.
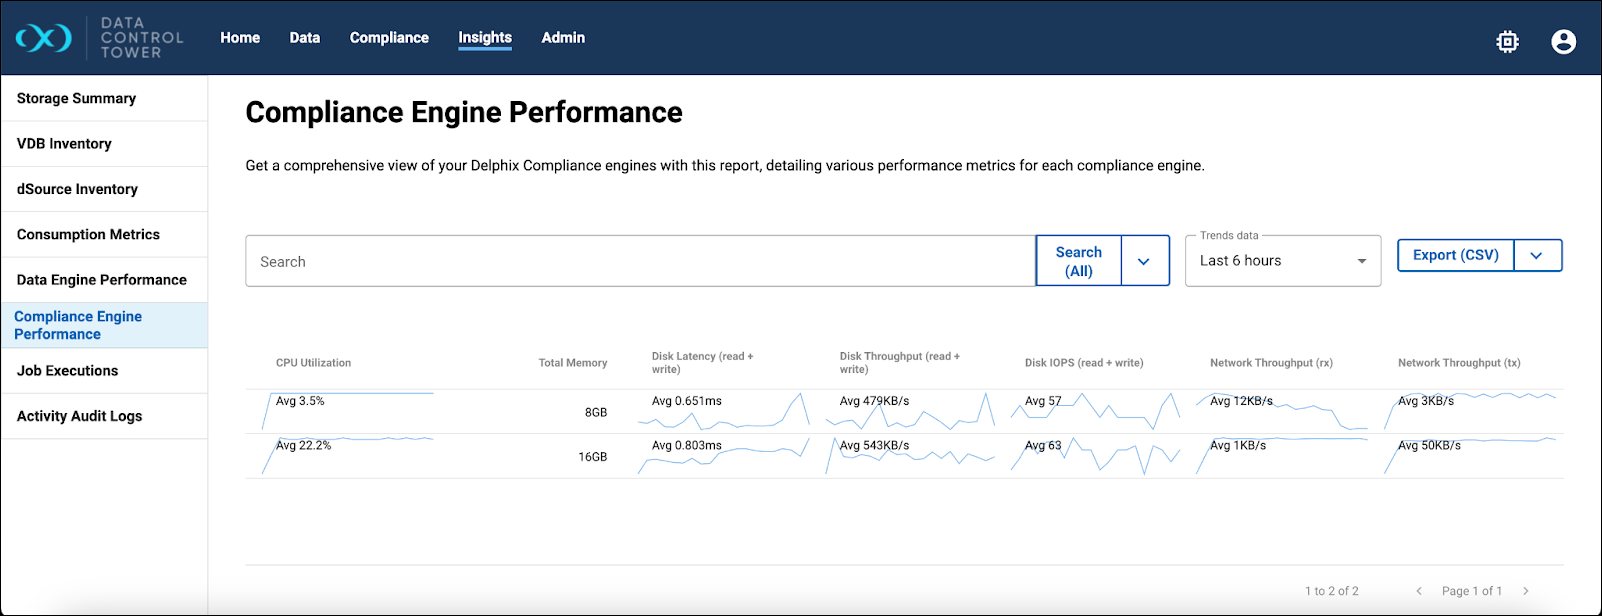
Continuous Compliance Engine Performance report
The Engine Performance dashboard provides users with a comprehensive view of performance information for Delphix Continuous Compliance Engines. The performance metrics include system CPU utilization, system memory usage, latency and throughput details for Disk protocols, and network throughput.
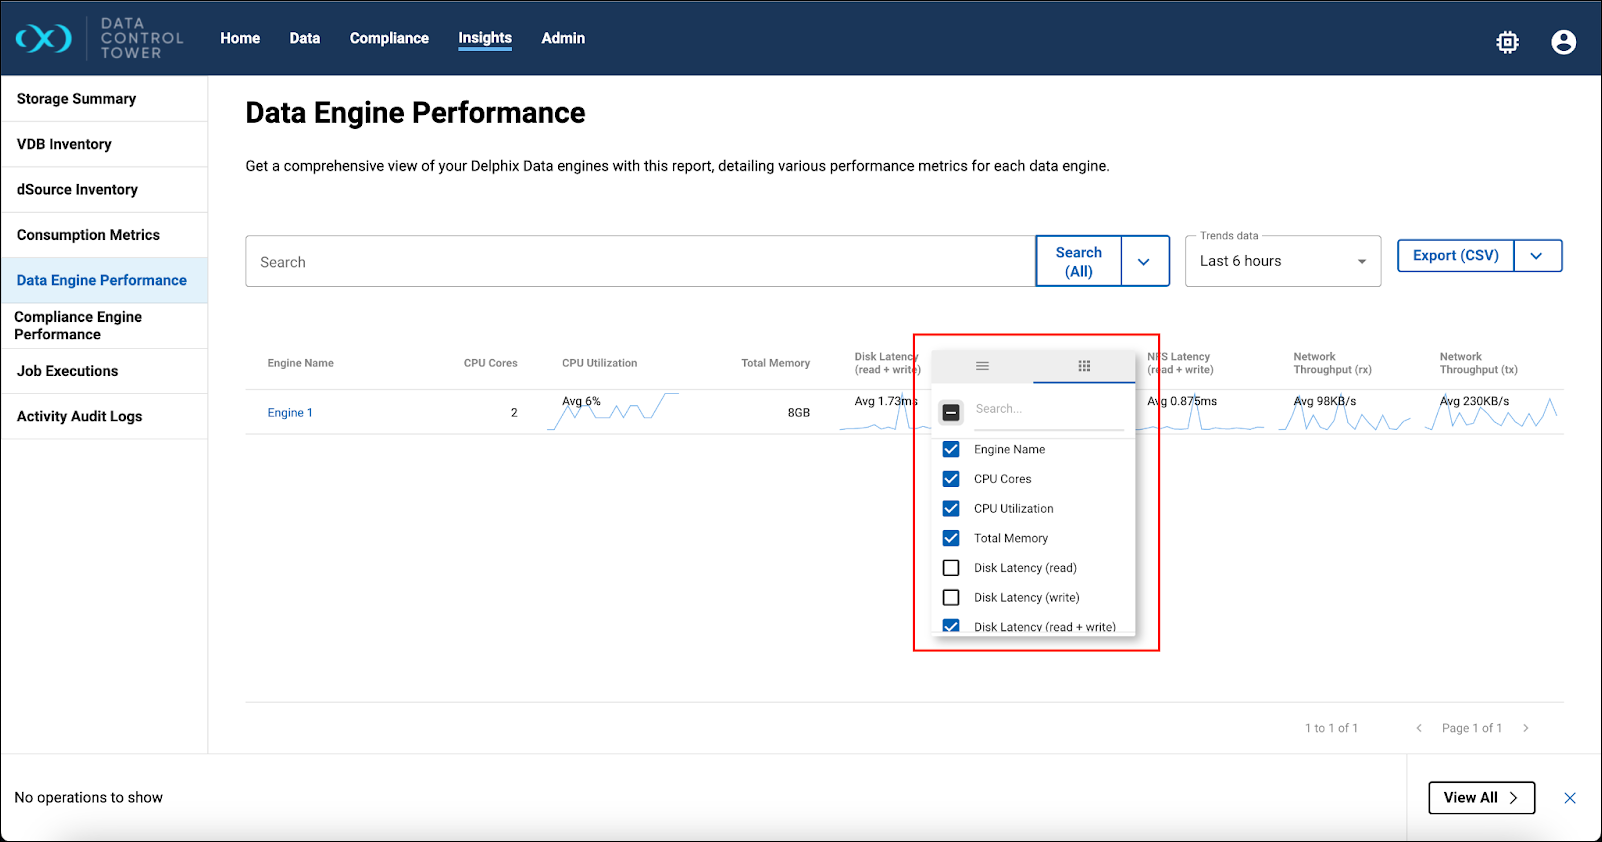
Continuous Data Engine Performance report
The Engine Performance dashboard provides users with a comprehensive view of performance information for Delphix Continuous Data Engines. The performance metrics include system CPU utilization, system memory usage, latency, IOPS, and network throughput details for Disk, NFS, and iSCSI protocols.
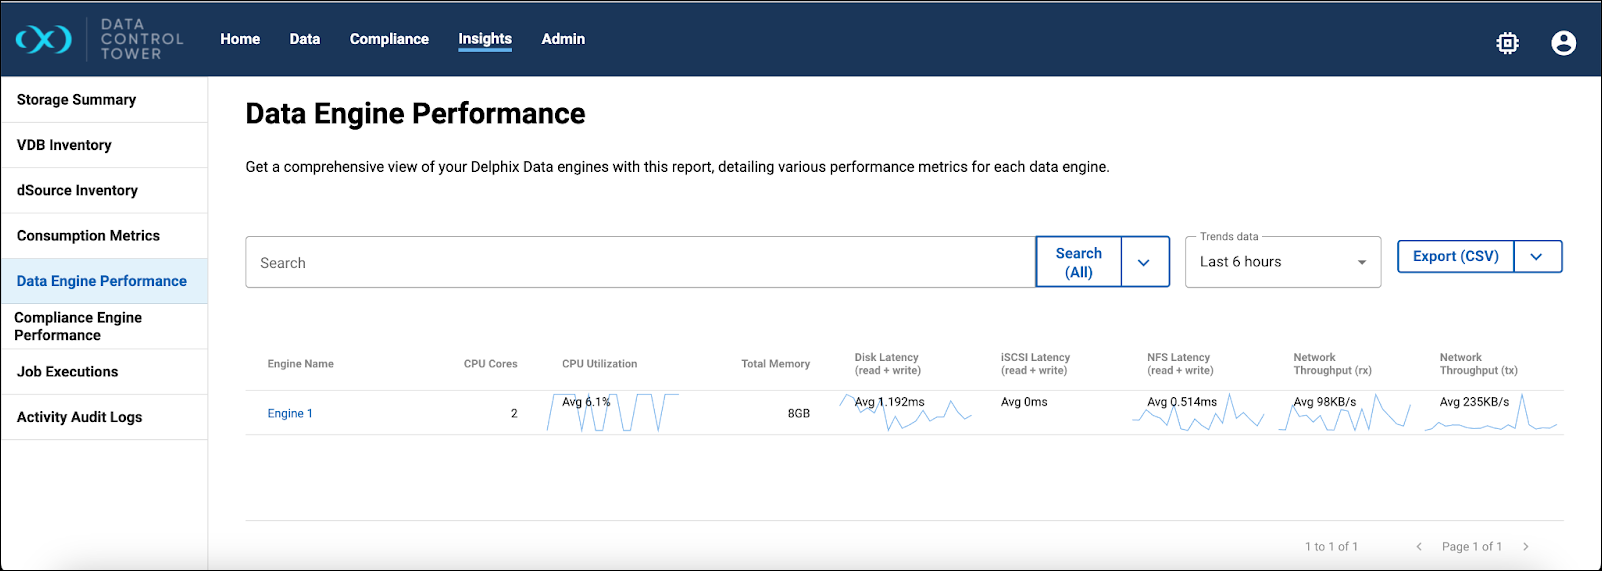
By default, a fix set of data columns are shown. Users have the flexibility to add or remove columns based on their preferences.
dSource Inventory report
The dSource Inventory report provides users with a comprehensive list of all the dSources created in the DCT platform and their identification metadata.
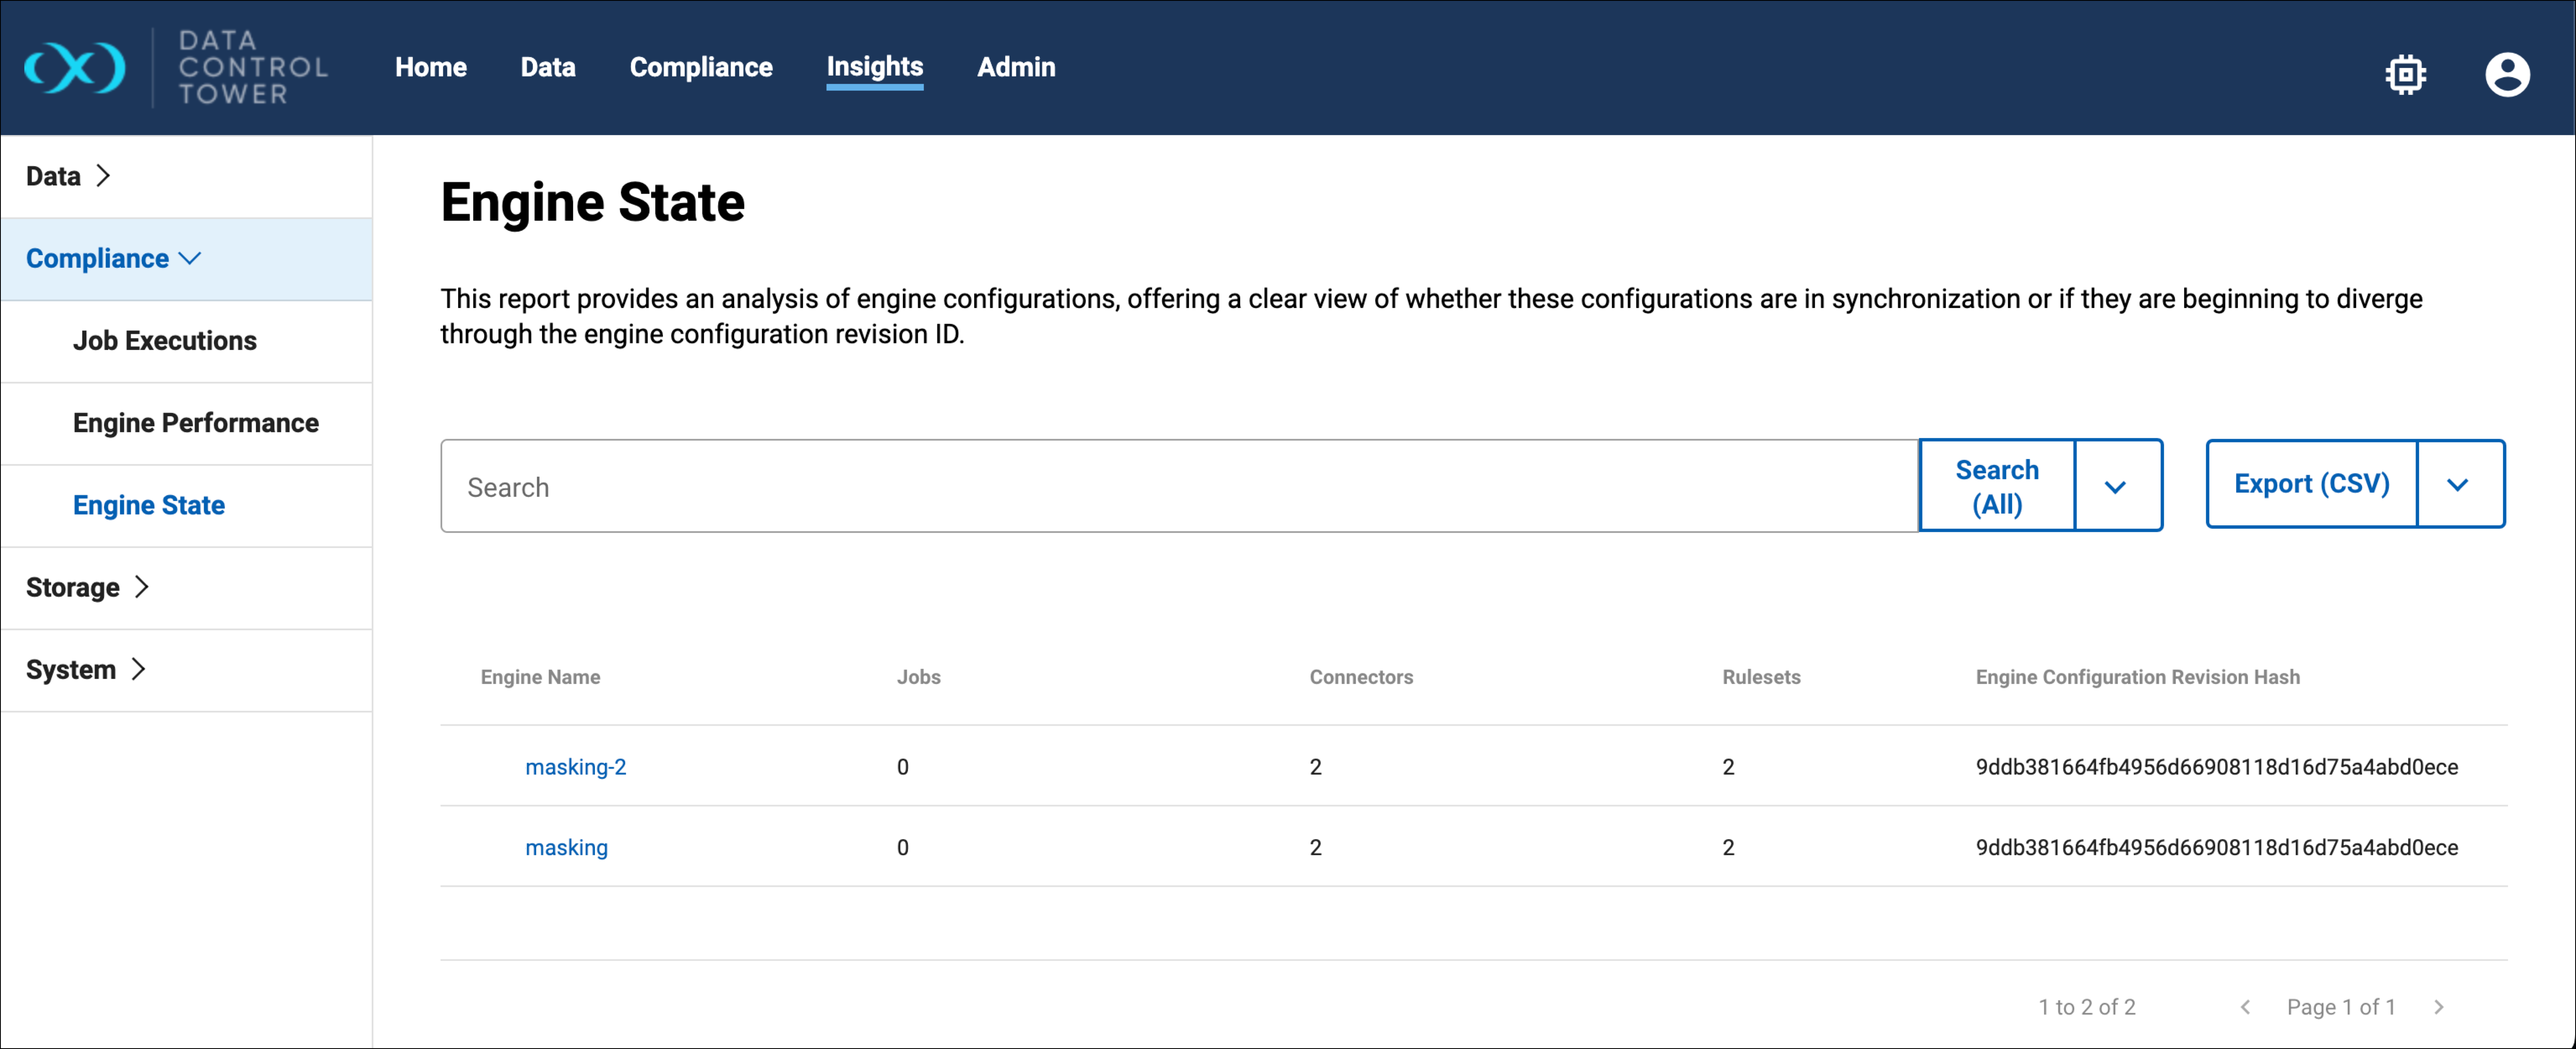
Global State report
The Compliance Engine (Global) State report provides the users with an overview of which engines are in sync and can be used to horizontally scale a compliance job. The users should use the Engine Configuration Revision Hash (Global Object Revision Hash) to determine if engines are synced – they have identical global object like (algorithms, rule sets, domains, etc.). Search filtering and sorting can be used to find all engines that are in-sync, and also determine if an engine has fallen out of sync. If the user wants to take action by then syncing an un-synced engine, they can do so from the Hyperscale Orchestrators' details page via the Manually Deploy Job Dependencies action menu.
Source Ingestion Metrics
The Data Source Ingestion Metrics dashboard is designed to help users find their virtualization source ingestion metrics, which are often required for contract renewal purposes. The dashboard contains the data sources and informs the user of the total size of that ingestion source.
VDB Inventory report
The VDB Inventory report provides users with a comprehensive list of all the Virtual Databases (VDBs) created in the DCT platform and their identification metadata.
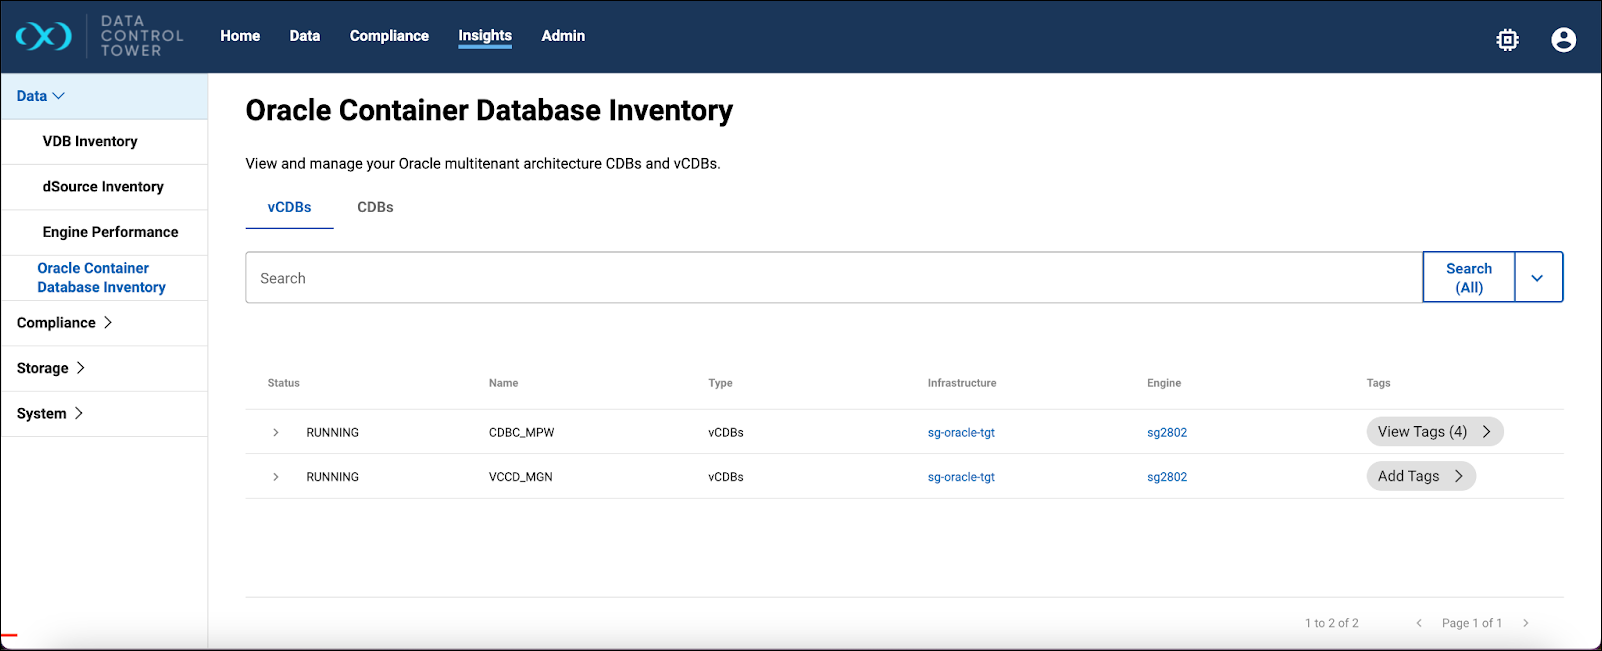
Oracle Container Database Inventory report
This report provides a comprehensive list of all Container Databases (CDBs) and virtual Container Databases (vCDBs). This report features an expandable list that reveals pluggable data associated with each CDB or vCDB, providing in-depth visibility into your Oracle database environment at a glance.