Engine details page
This page describes the many tabs available with different insights and configurations pertaining to the connected engines in DCT. Each sub-section is the name of a corresponding tab in the Engine details page.
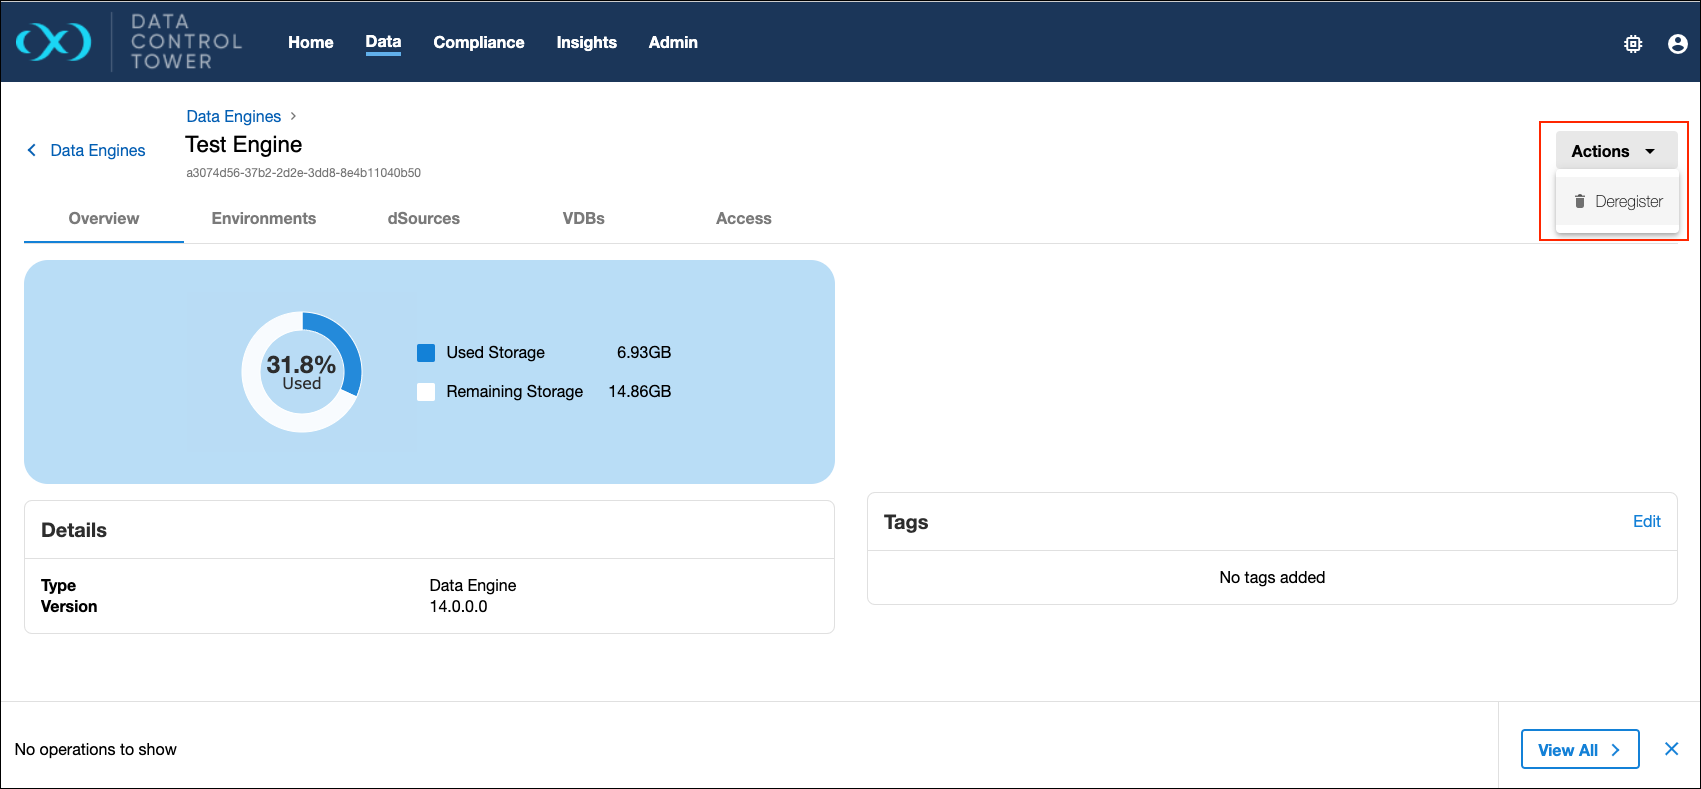
Overview
Individual engine details can be seen and acted upon by clicking down on a particular engine detailed view. Once clicked, users will be sent to an Overview tab that provides relevant metadata related to the engine. From the Actions menu, you can also Deregister an engine.
Deregistering or deleting an engine can also be done via the API with: curl --location --request DELETE '<https://<DCT Host Name>:<Port>/v3/management/engines/<ID or Name of the Engine to be deleted>' \--header 'Authorization: apk <api key for authentication>'
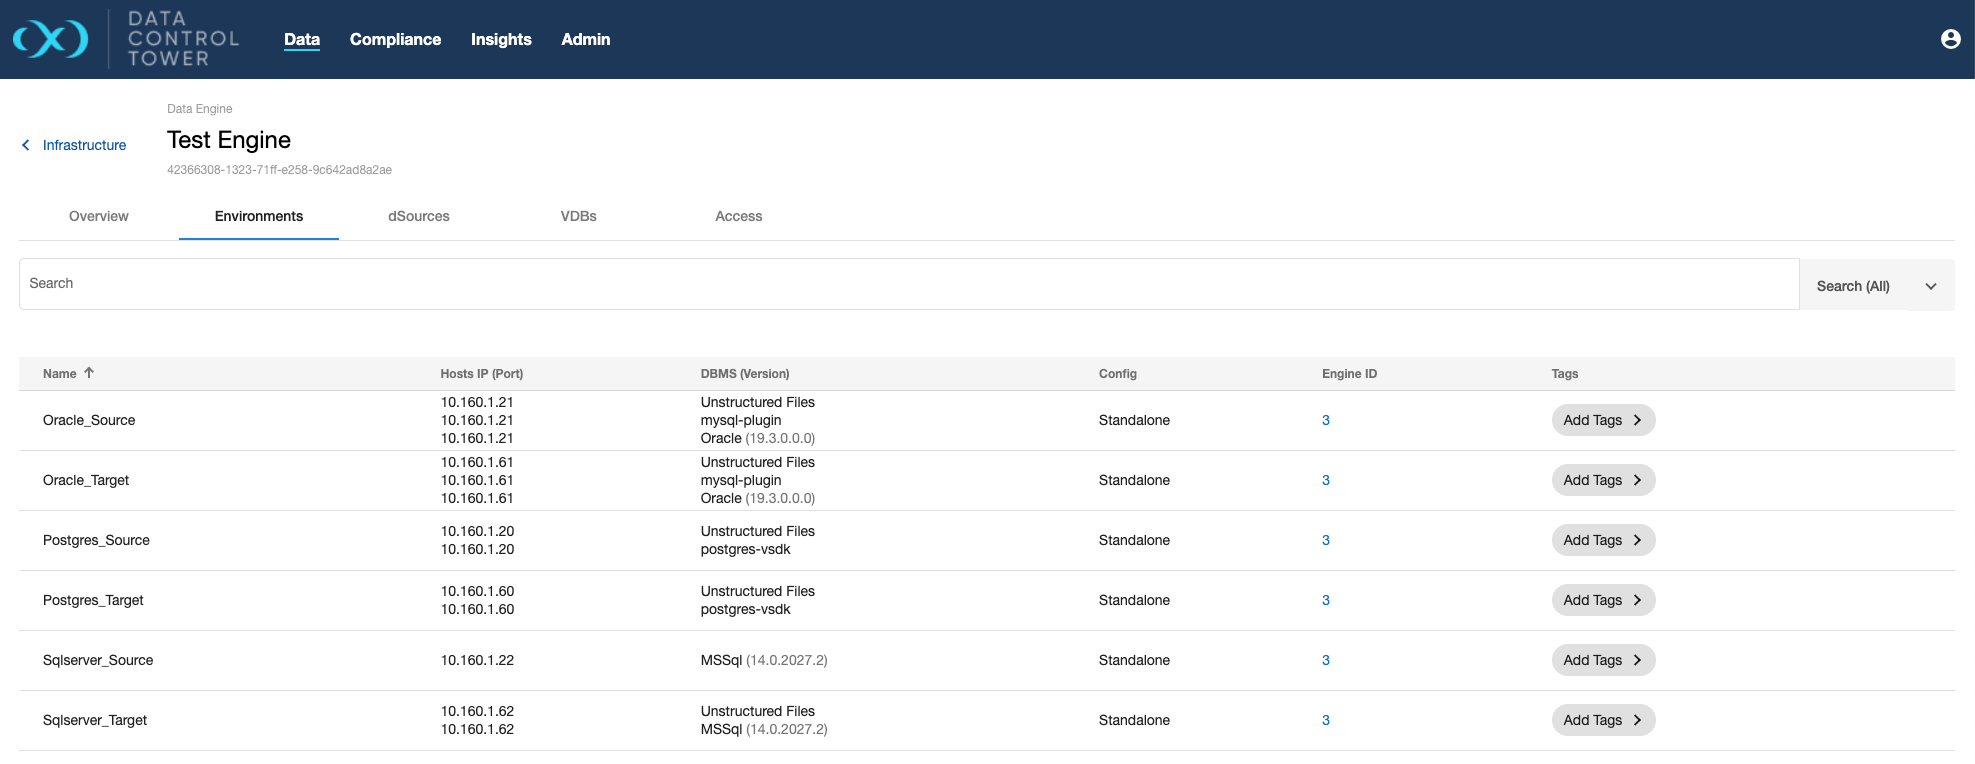
Environments
The Environments tab presents all environment connections to that particular engine.
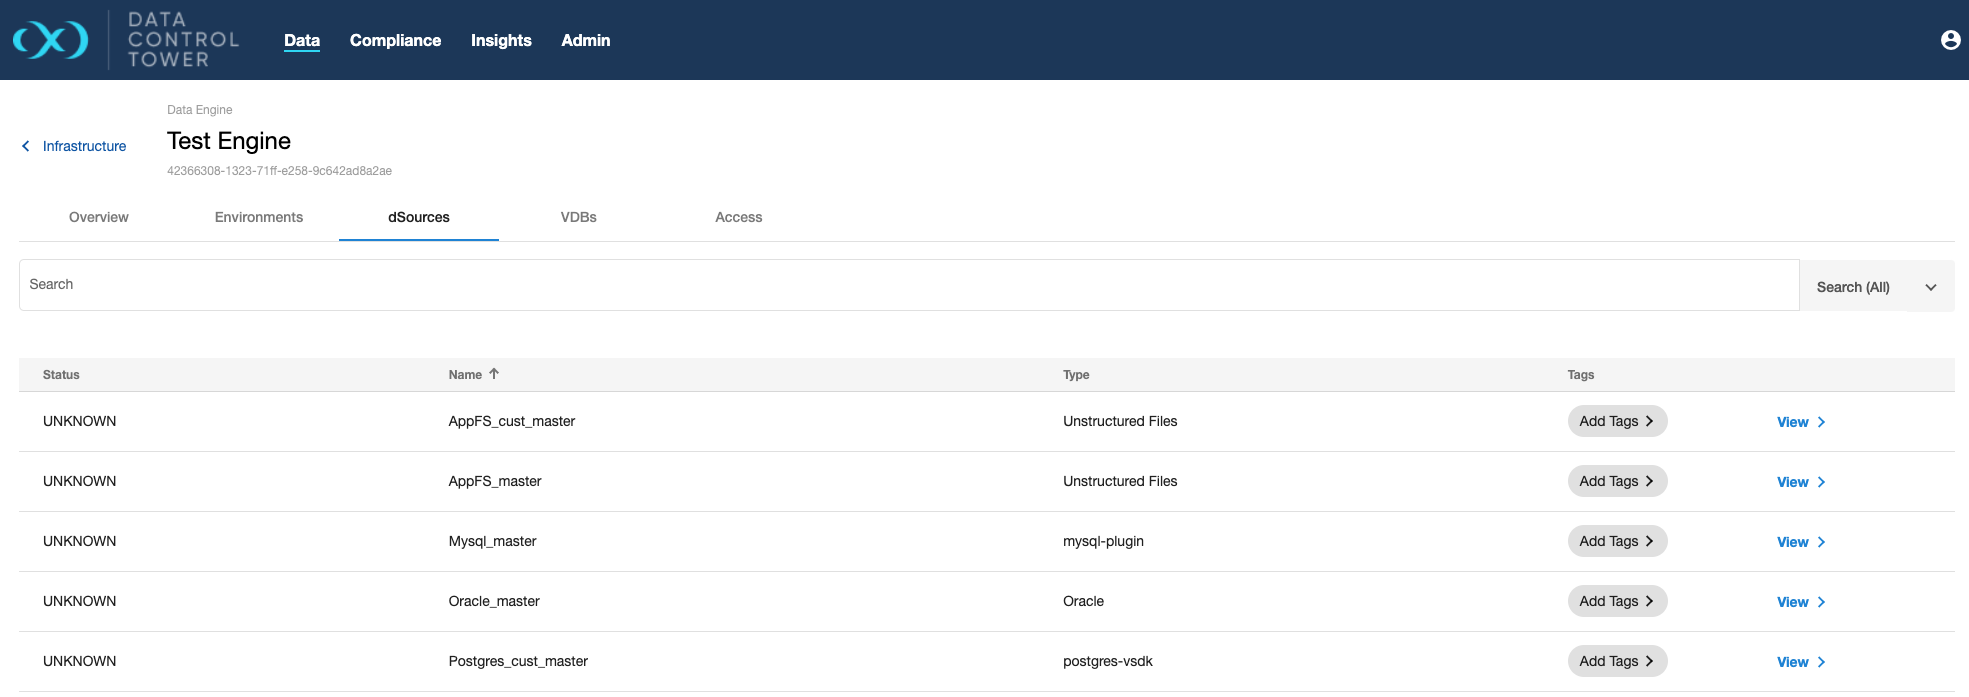
dSources
The dSources tab presents all dSources associated with the selected engine. Clicking the "View" button will link the user directly to the associated dSource page.
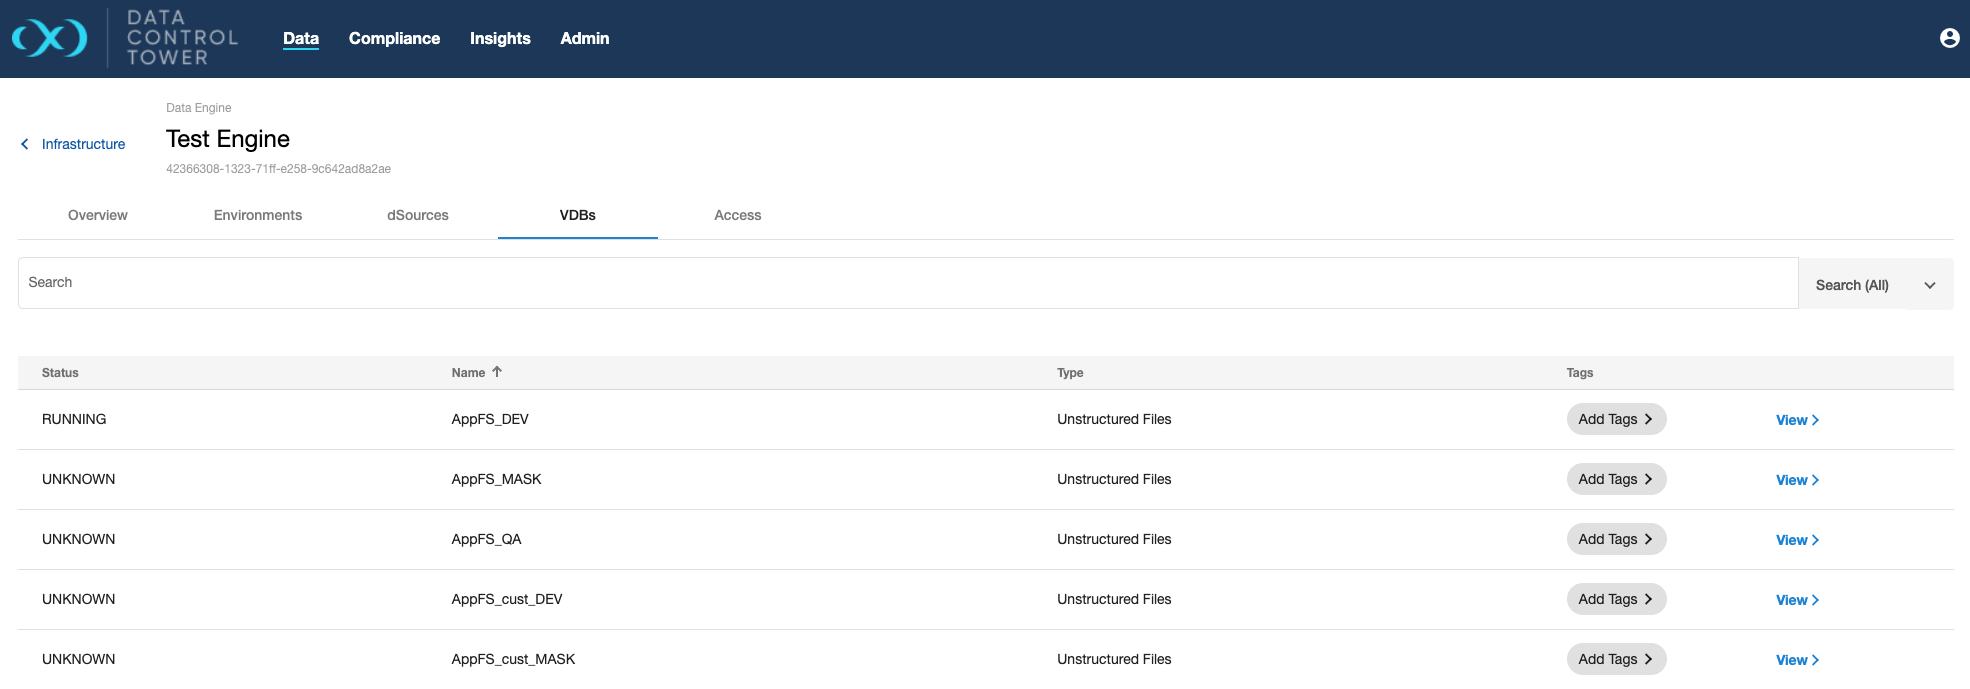
VDBs
The VDBs tab presents all VDBs associated with the selected engine. Clicking the "View" button will link the user directly to the associated VDB page to take action.
Storage
The Storage tab on the engine details page to provide detailed information about the space occupied by datasets on the engine. This data can be visualized using an interactive graph.
There are two ways to view this information on the graph:
Component Storage
This option visualizes storage data using a stacked area series chart, offering a detailed breakdown of storage components on the engine. By default, the chart displays data for the last 3 months, with an option to extend the view to the last 6 months using a dropdown. This provides a comprehensive understanding of space allocation and utilization over time.
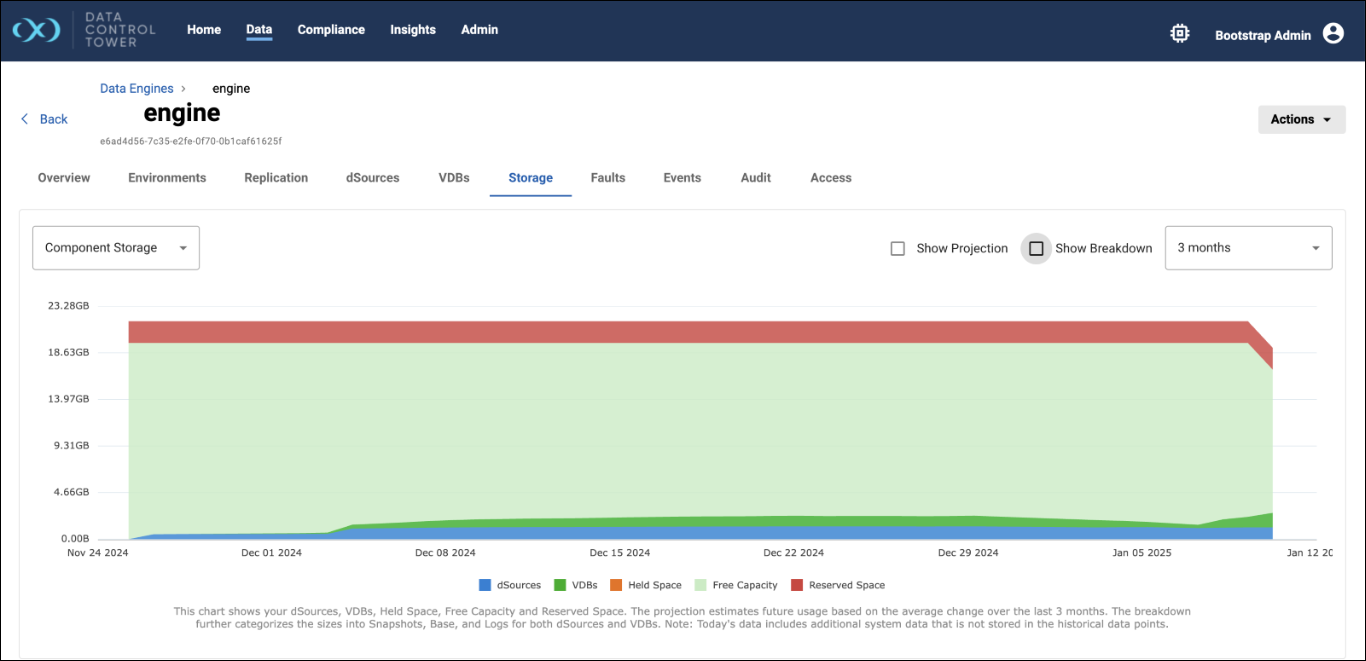
The chart includes the following components:
dSources: Represents the storage used by data sources on the engine.
VDBs (Virtual Databases): Shows the storage utilized by virtual databases.
Held Space: Denotes space reserved or held for specific operations or recovery purposes.
Free Capacity: Indicates the remaining available storage on the engine.
Reserved Space: Displays the space allocated for future use or reserved for system operations.
Additionally, the chart includes the following features:
Show Breakdown: A checkbox that enables further segmentation of dSources and VDBs storage into logs, base, and snapshot sizes, offering a more granular view of storage usage.
Show Projection: A checkbox that allows users to view projected storage trends, helping in future capacity planning.
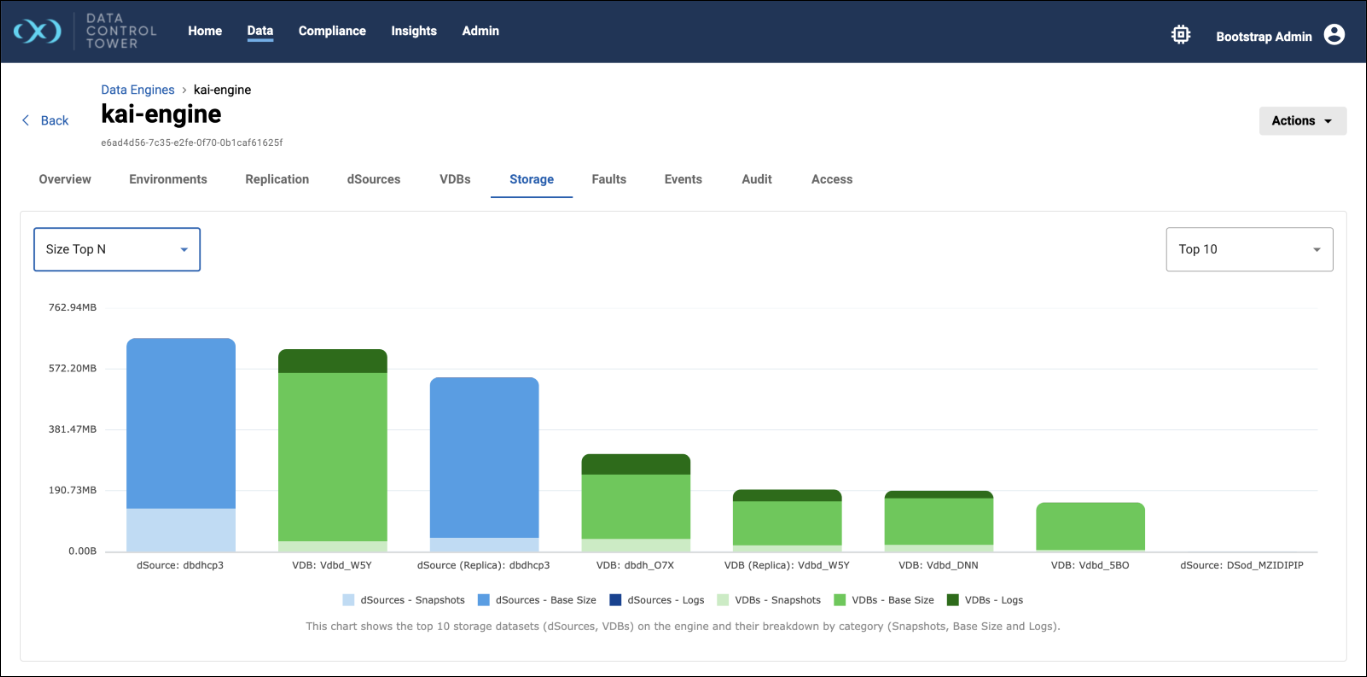
Size Top N
This option visualizes storage data for dSources and VDBs using a stacked bar series chart. The chart displays the top 10 dSources and VDBs by default, with an option to view the top 15 datasets using a dropdown. The visualization provides a detailed breakdown of storage components, including logs, base, and snapshot sizes, allowing users to analyze and compare storage usage effectively.
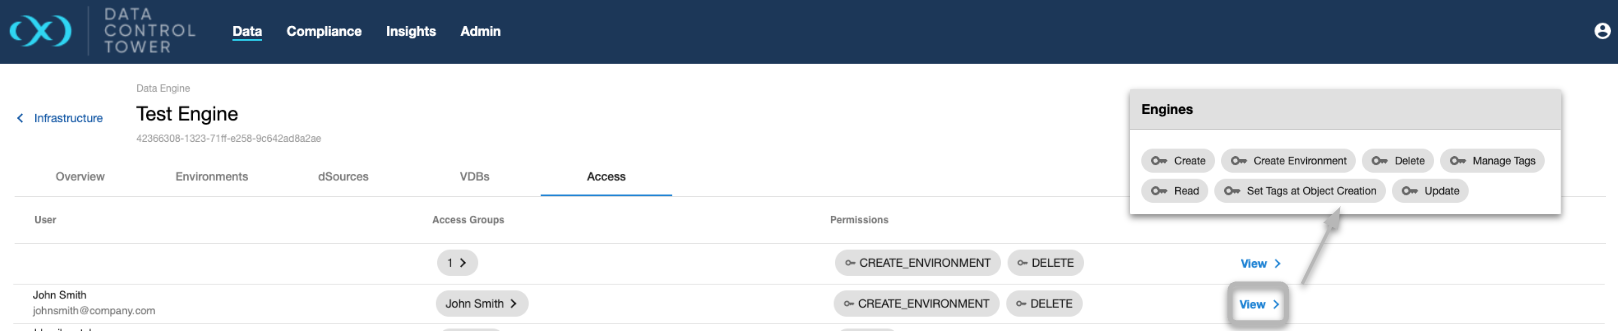
Access
Users are able to audit which users have operations access to this particular engine, what access group they belong to, and the associated permissions that each user has on this engine. Admins are able to click on the View button to access further details under the access control screen related to that specific user.