
Compliance jobs (read-only)
This iteration aims to elevate the existing compliance jobs feature in DCT by bringing changes to the existing UI experience. These changes include making additional information on jobs and executions available, several UX enhancements, and introducing a brand-new Compliance Job Execution details page—which offers a more granular view into executions, such as the execution components, the events that occurred during, and the recorded logs.
Change list
Compliance Jobs page

The Execution Type column was previously named Job Type. It shows whether the execution type is Standard or Hyperscale.
The Type column is newly introduced. It shows whether the job is for Masking, Discovery, Tokenization, or Reidentification.
The Is On The Fly Masking column is newly introduced, which is hidden by default, but can be manually toggled on.
The Source column is newly introduced. It shows the engine name in the form of a link that redirects the user to the engine’s details page.
The Start Time and Run Time columns are newly introduced in lieu of the previous Last Completed Execution Date column.
Compliance Job details page
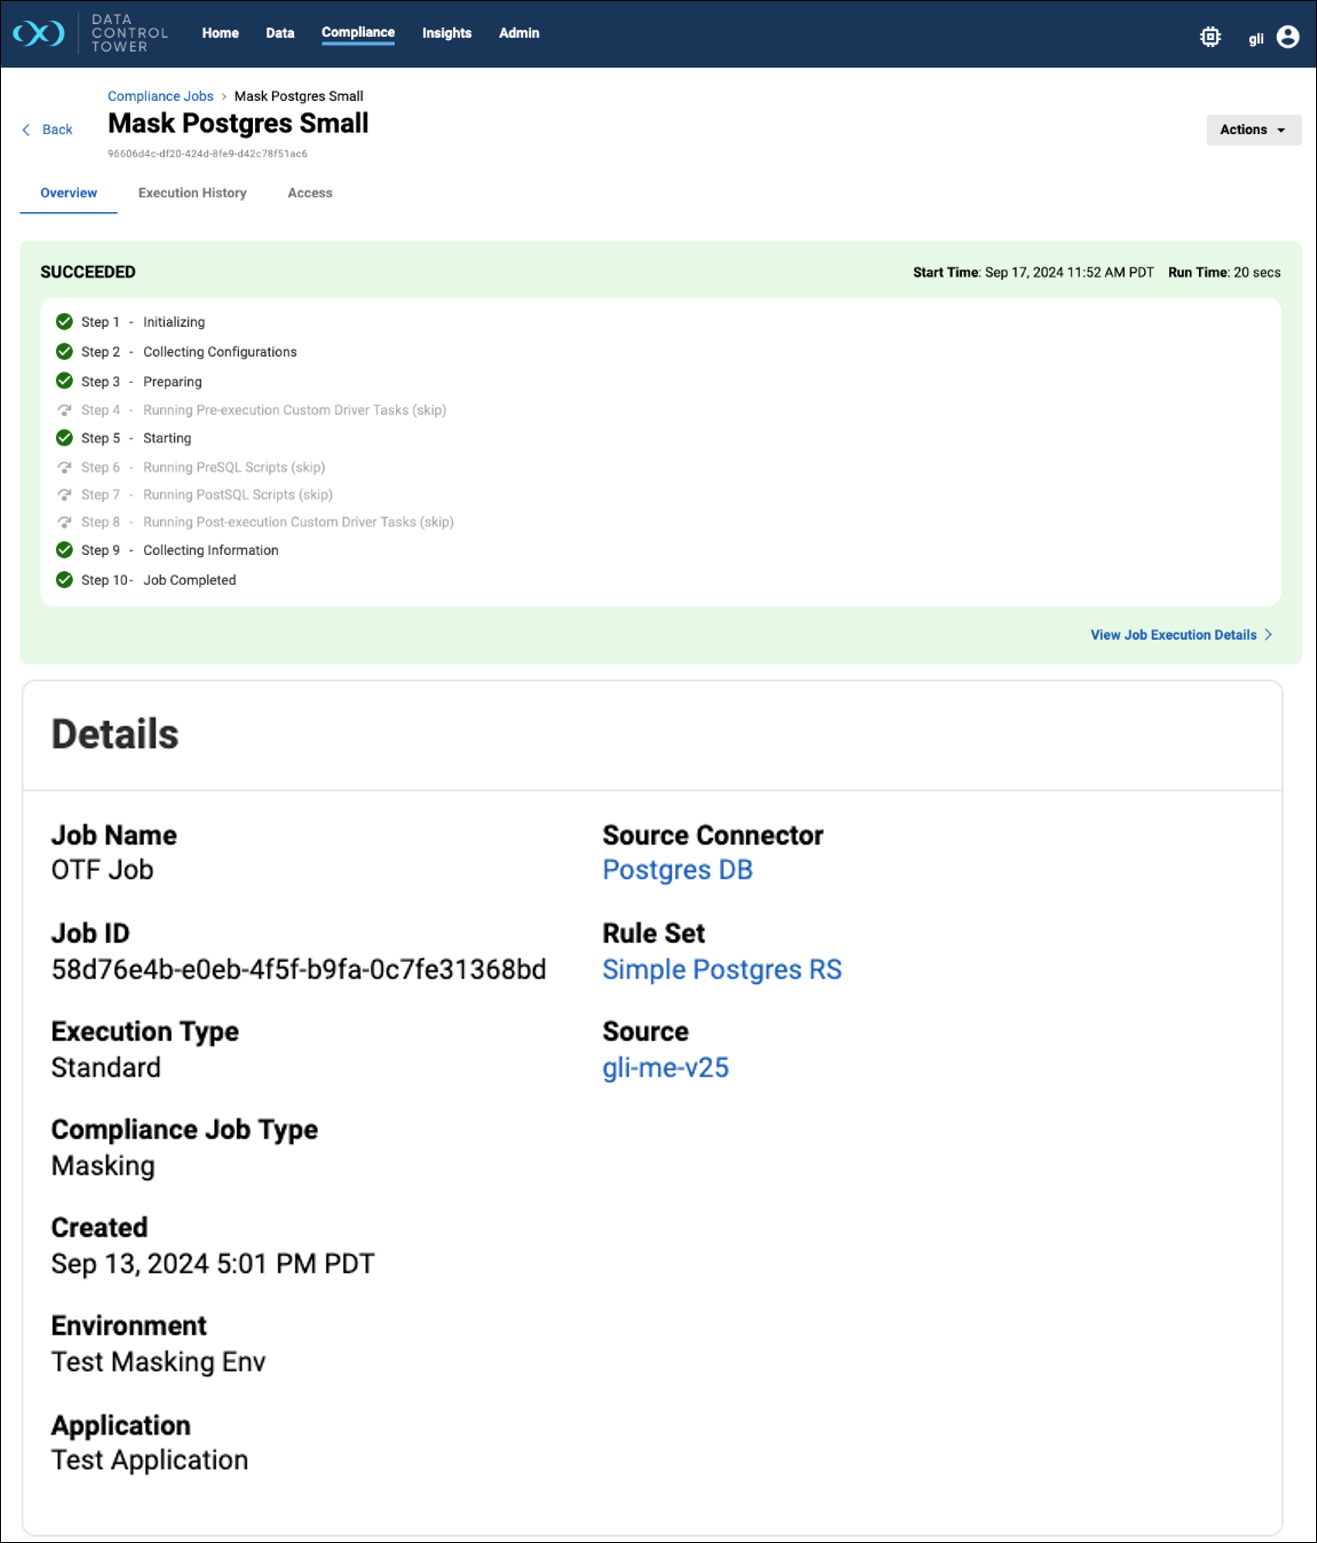
In the top execution status tile section, the Start Time now shows both the date and time (previously it was only showing time).
The top execution status tile now has a View Job Execution Details button, which will redirect to the details page for this job’s latest execution (the execution details page is a new UI introduced in this feature).
The Details tile now shows much more metadata for the job. The information shown is as follows:
Job ID and Job Name
Execution Type (Standard or Hyperscale)
Compliance Job Type (Masking, Discovery, Tokenization, or Re-Identification)
Creation date
Environment name on the engine
Application name on the engine
Rule Set
Source (Engine)
Only if this is an On-The-Fly Job, we also show the Source Connector
Execution History tab
These new columns were added. Some columns are hidden by default and need to be manually toggled on (noted below).
Rows Processed: The number of rows masked. This is not applicable to JSON.
Rows Total (hidden by default): The total number of rows. This is not applicable to JSON.
Bytes Processed: The number of bytes masked. This is only applicable to JSON files and ASDD profiling jobs on XML files.
Bytes Total (hidden by default): The total number of bytes. This is only applicable to JSON files and ASDD profiling jobs on XML files.
Started By (link): DCT user who started this job (from DCT). If the job was not started from DCT, this will not be set.
Queue Duration (hidden by default): how long this execution spent in the queue (between submit and executing) on the engine.
Run Duration: How long this execution took to run.
Total Duration (hidden by default): How long it took when this job was started from DCT to when it completed on the engine.
Start Time: When the job was started to execute.
Execution Details page (new)
This feature introduces a new UI for compliance job execution details. In the Compliance Job Execution History list, each execution has a View button, which will take you to the details page for that execution.
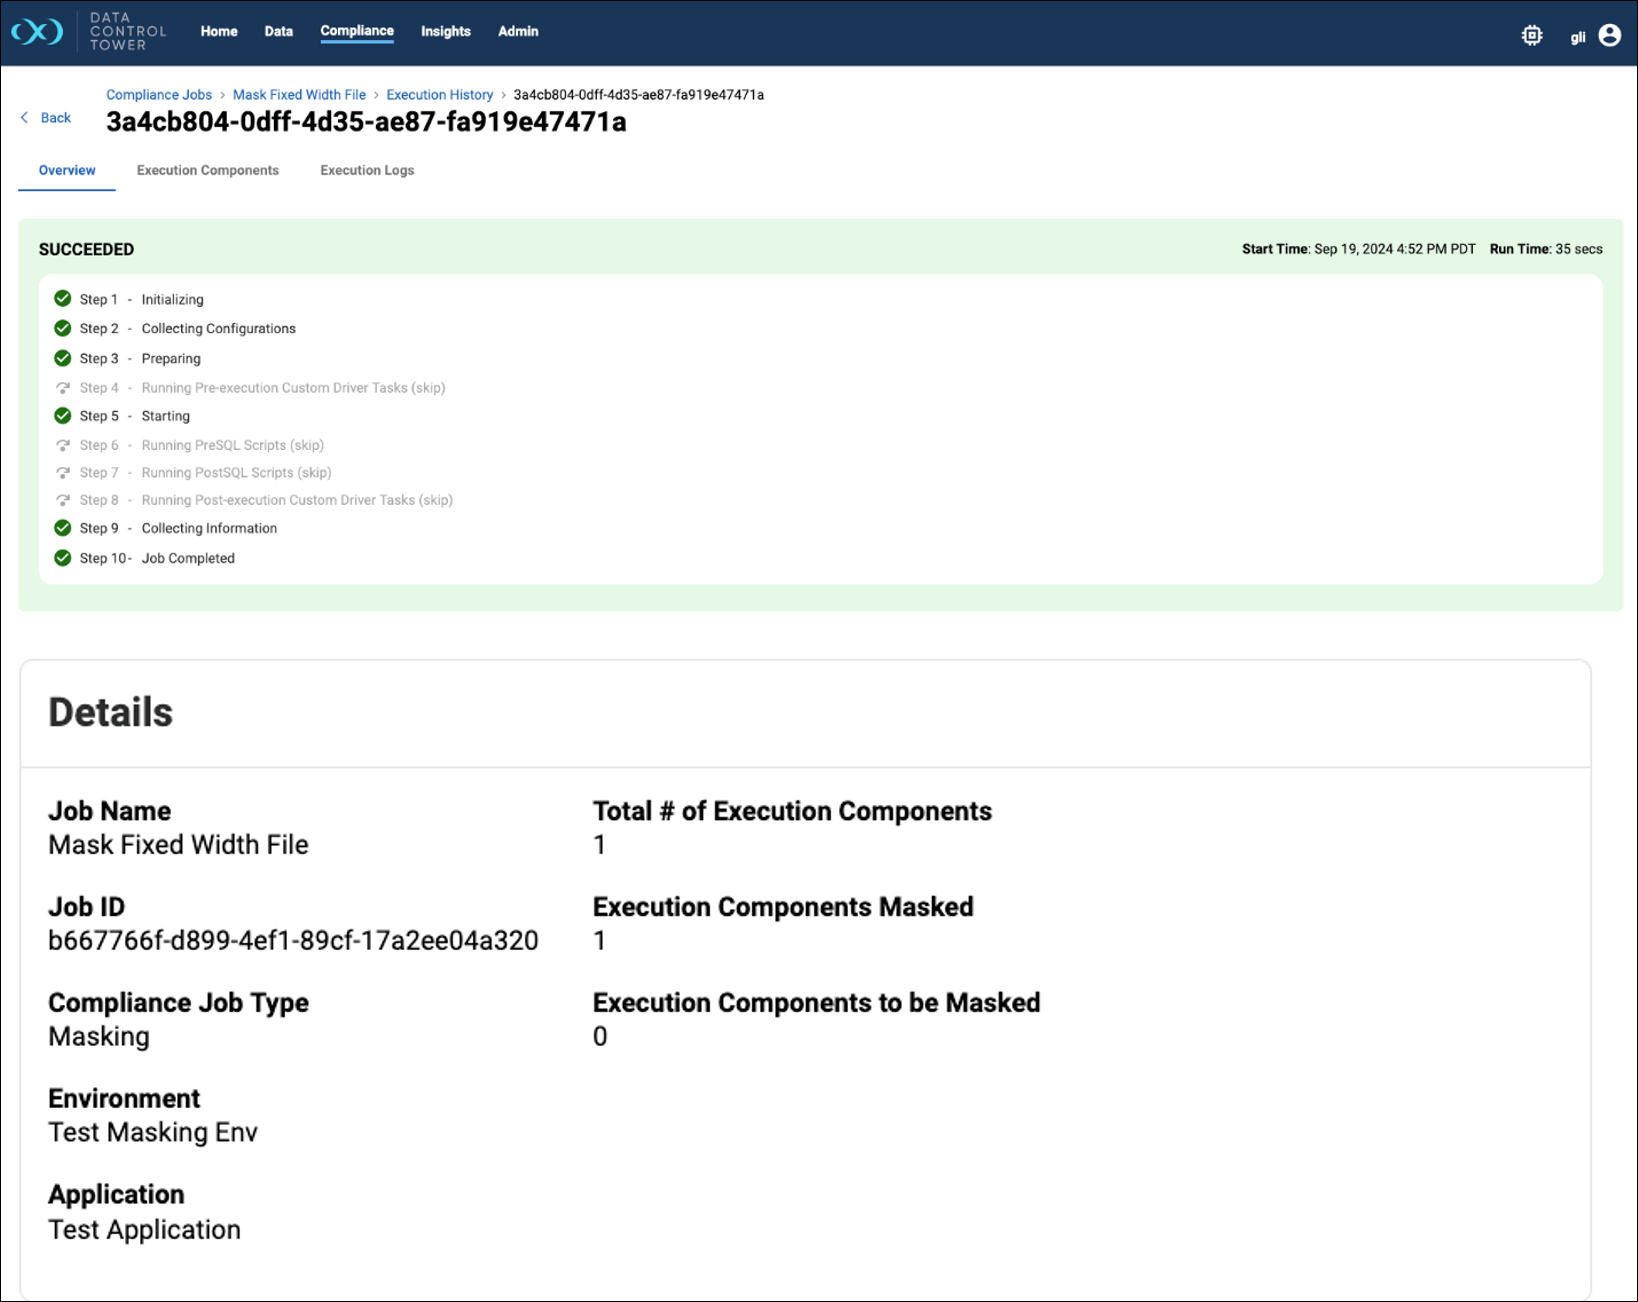
The Overview tab for an execution details page includes a status tile at the top which shows the steps the execution has taken.
It is then followed by a Details tile, which includes a few metadata for the execution, including:7
Name, ID, Compliance Job Type for the parent job of this execution.
Environment and Application name.
The number of execution component masked/discovered, yet-to-be masked/discovered, and the total number.
Execution Components tab
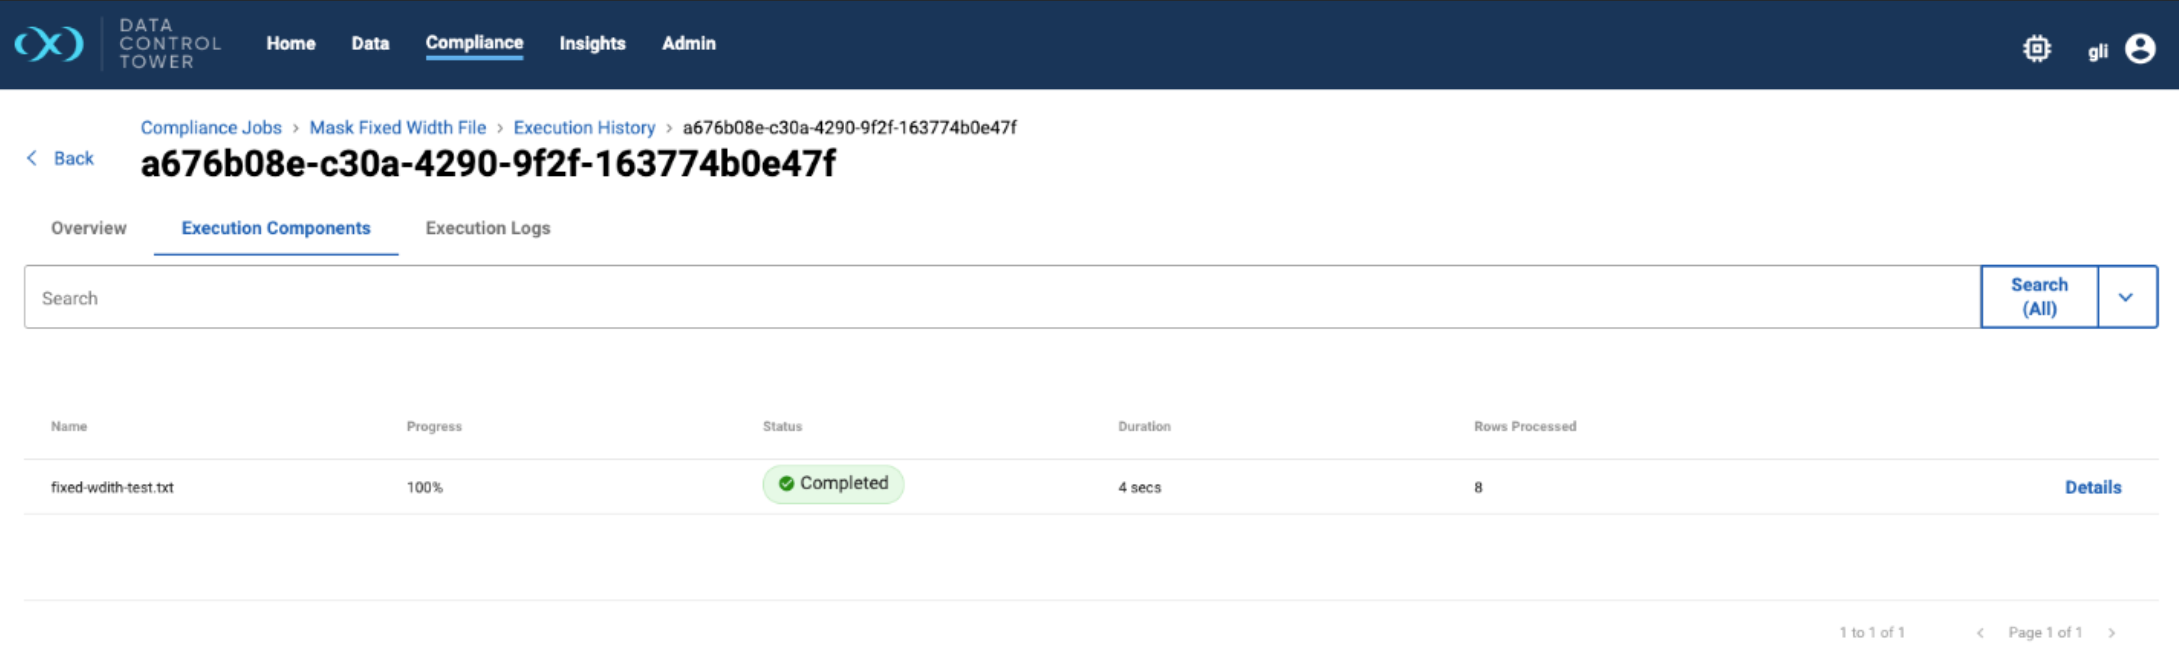
This tab is part of the execution details page and shows a list of execution components for the execution. By default, we show the name, progress (in percentage), status, duration, and rows processed columns. But there are a few additional columns that can be manually toggled on. Including
Rows Total
Bytes Processed
Bytes Total
Non-Conformant Data
In addition, each execution component in the list has a Details button which will open a dialog showing the events and logs that occurred for this execution component. Please note, the events and logs are only available when the execution is in a final state (succeeded, failed, or warning). Before then, there is no data to retrieve and therefore the execution component will not have the button.
Execution Logs tab
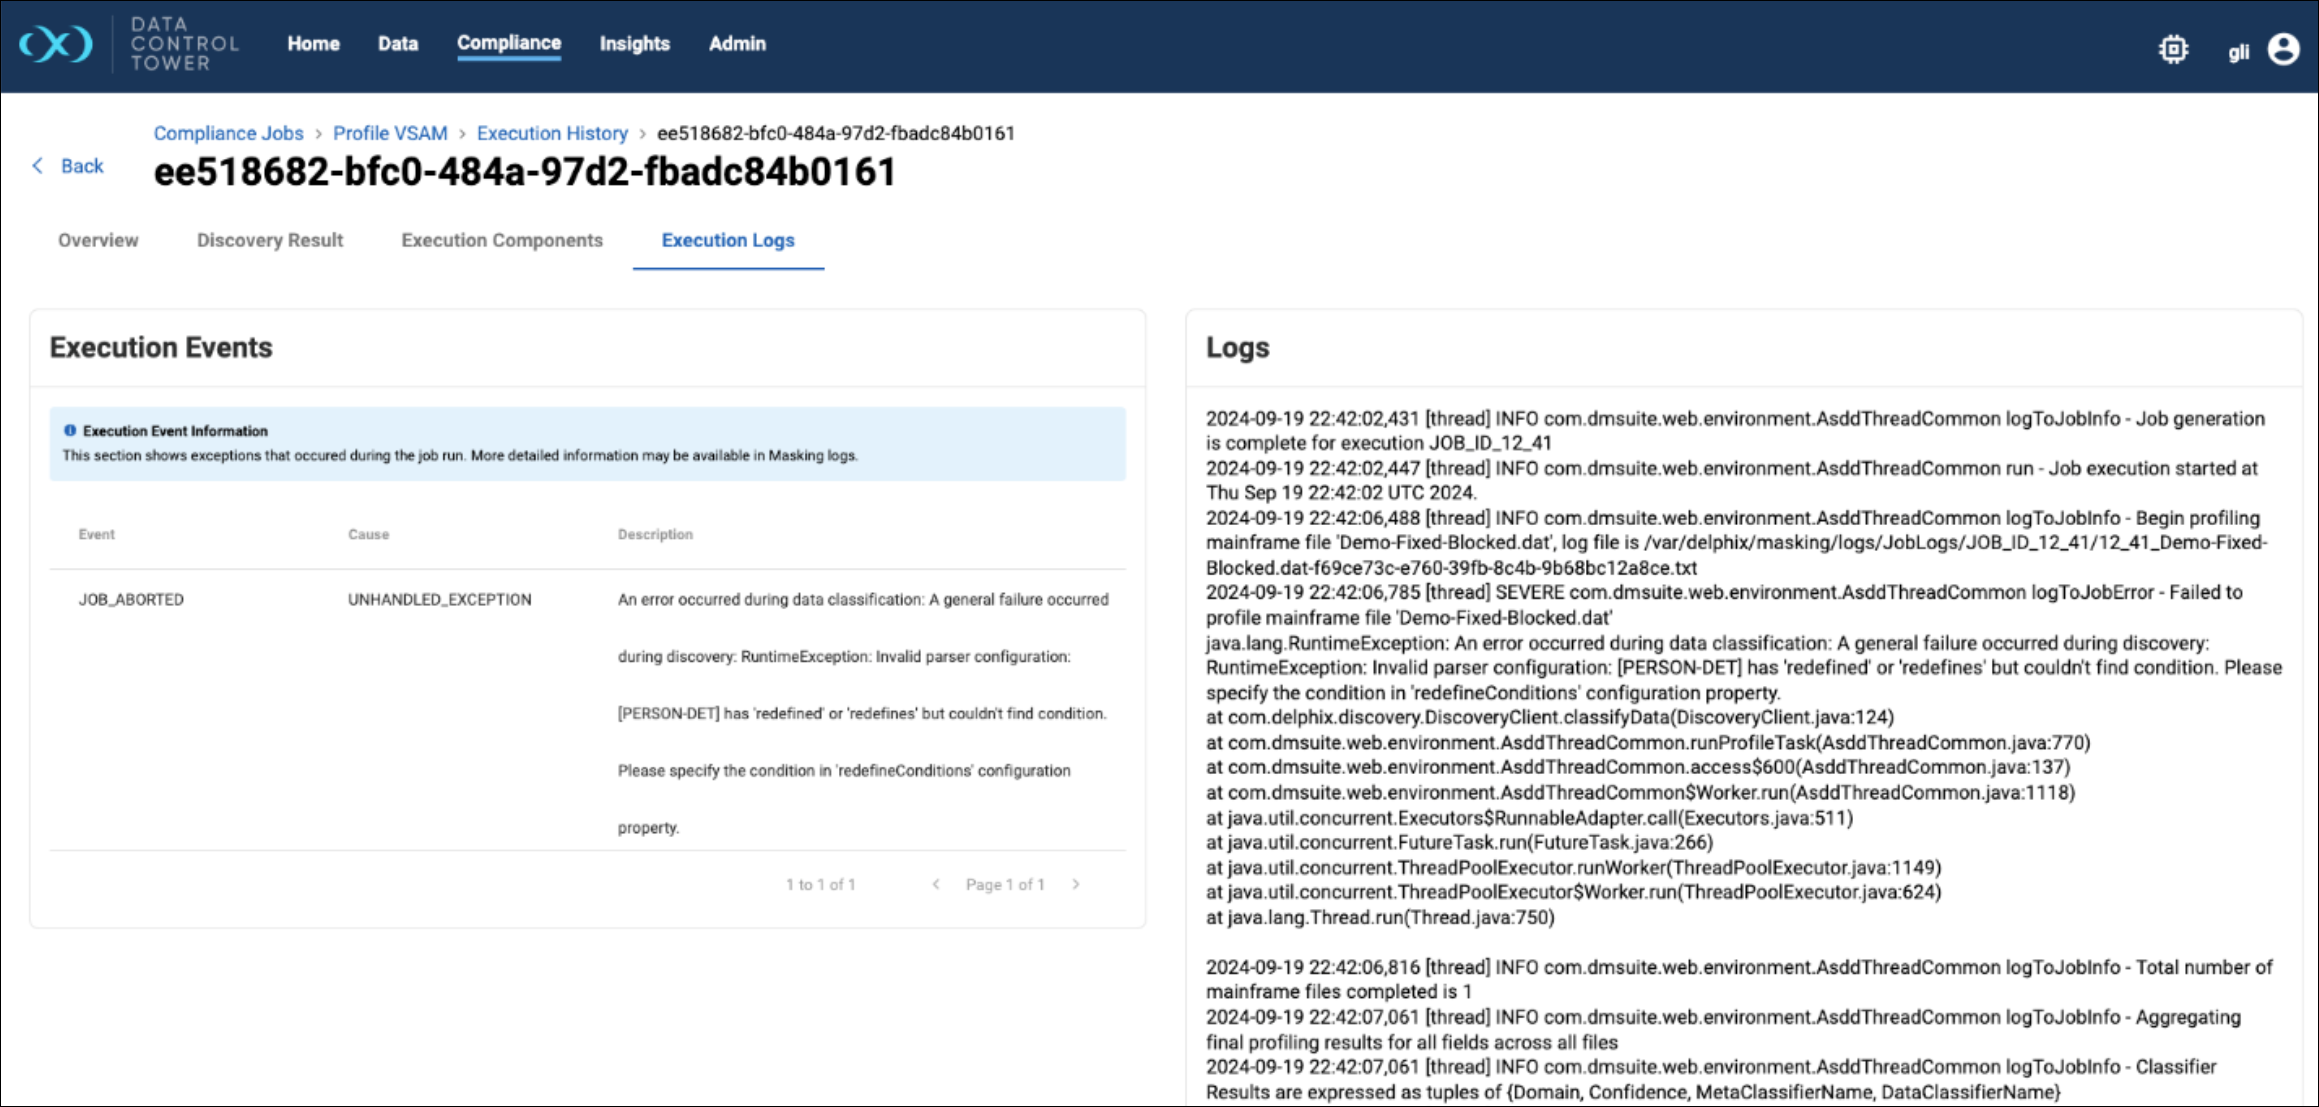
This tab is part of the execution details page and shows the events and logs for the execution. The events are shown on the left and logs are shown on the right.
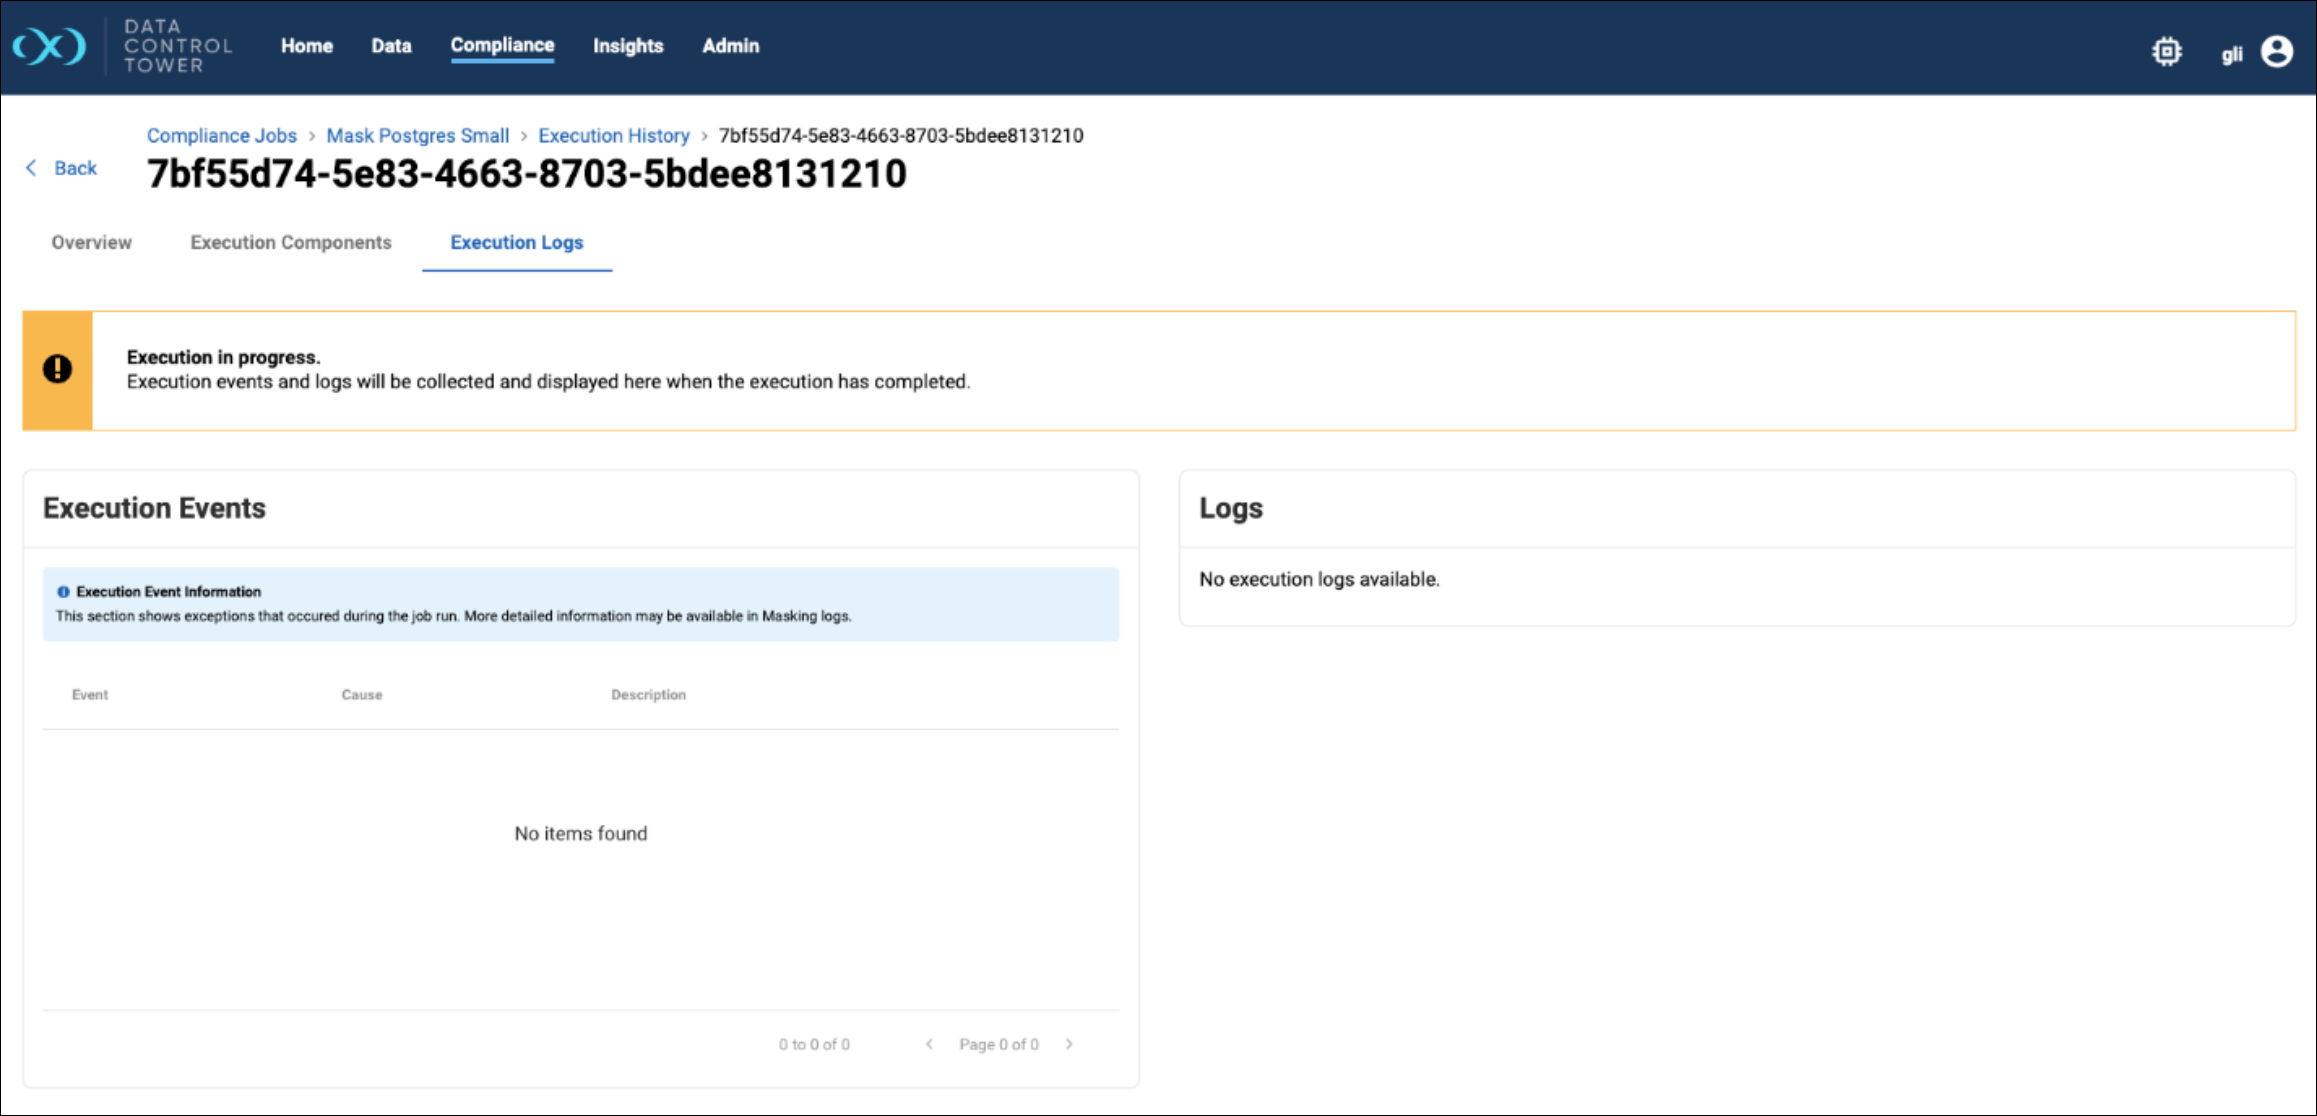
Events and logs are only available when the execution enters a final state (i.e. succeeded, failed, or warning). Before then, this tab will show a warning message. Once the execution transitions to a final state, this page should update once the data becomes available.