Exporting DCT logs to Splunk
Overview
This article provides some tips for configuring DCT (running on Kubernetes) to send logs to Splunk and extract useful information in Splunk.
Setting up a Splunk instance
Authenticate with Splunk via the web portal and install the third-party Monitoring Kubernetes app directly via the Splunk UI, then enable HTTP Event Collector in Splunk and save the HTTP Event Collector token for future use.
Enable Splunk log forwarding
Once the Splunk instance is setup, follow the instructions to install Splunk logic in the Kubernetes cluster to forward logs to Splunk. This blog post is a useful resources to understand the log collection and configuration options.
git clone https://github.com/splunk/splunk-connect-for-kubernetes.git
cd splunk-connect-for-kubernetes/helm-chart/splunk-connect-for-kubernetes
edit values.yaml
Edit values.yaml, at the minimum the host property (hostname of the Splunk collector) and token (of the HTTP Even Collector) must be set.
global:
 logLevel: info
 splunk:
   hec:
     # host is required and should be provided by user
     host: <insert-splunk-http-event-collector-hostname-here>
     # port to HEC, optional, default 8088
     port:
     # token is required and should be provided by user
     token: <insert-token-here>
Install the helm chart and and after a few minutes DCT logs will be visible in Splunk.
helm install splunk-connect-for-kubernetes . -f values.yaml --set splunk-kubernetes-logging.fullnameOverride=splunk-loggingSearch for events in Splunk
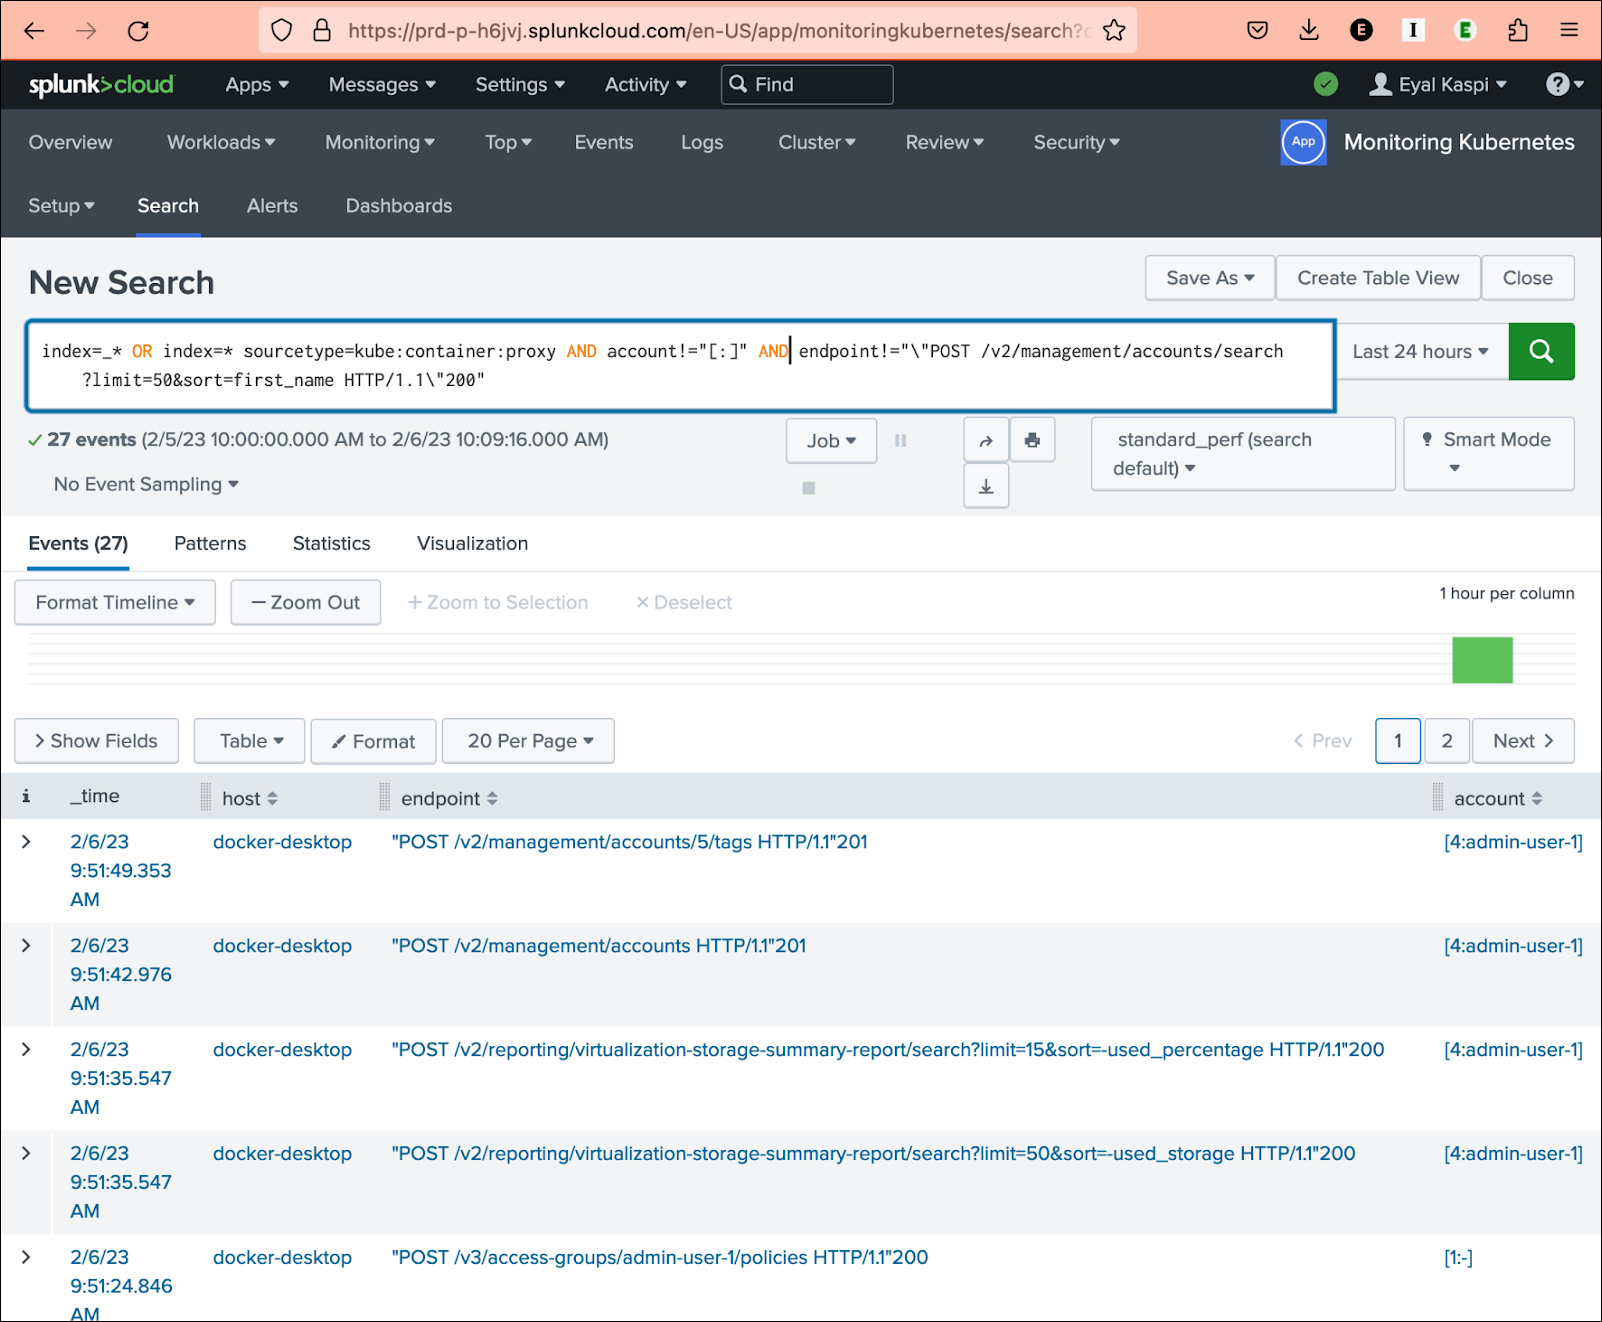
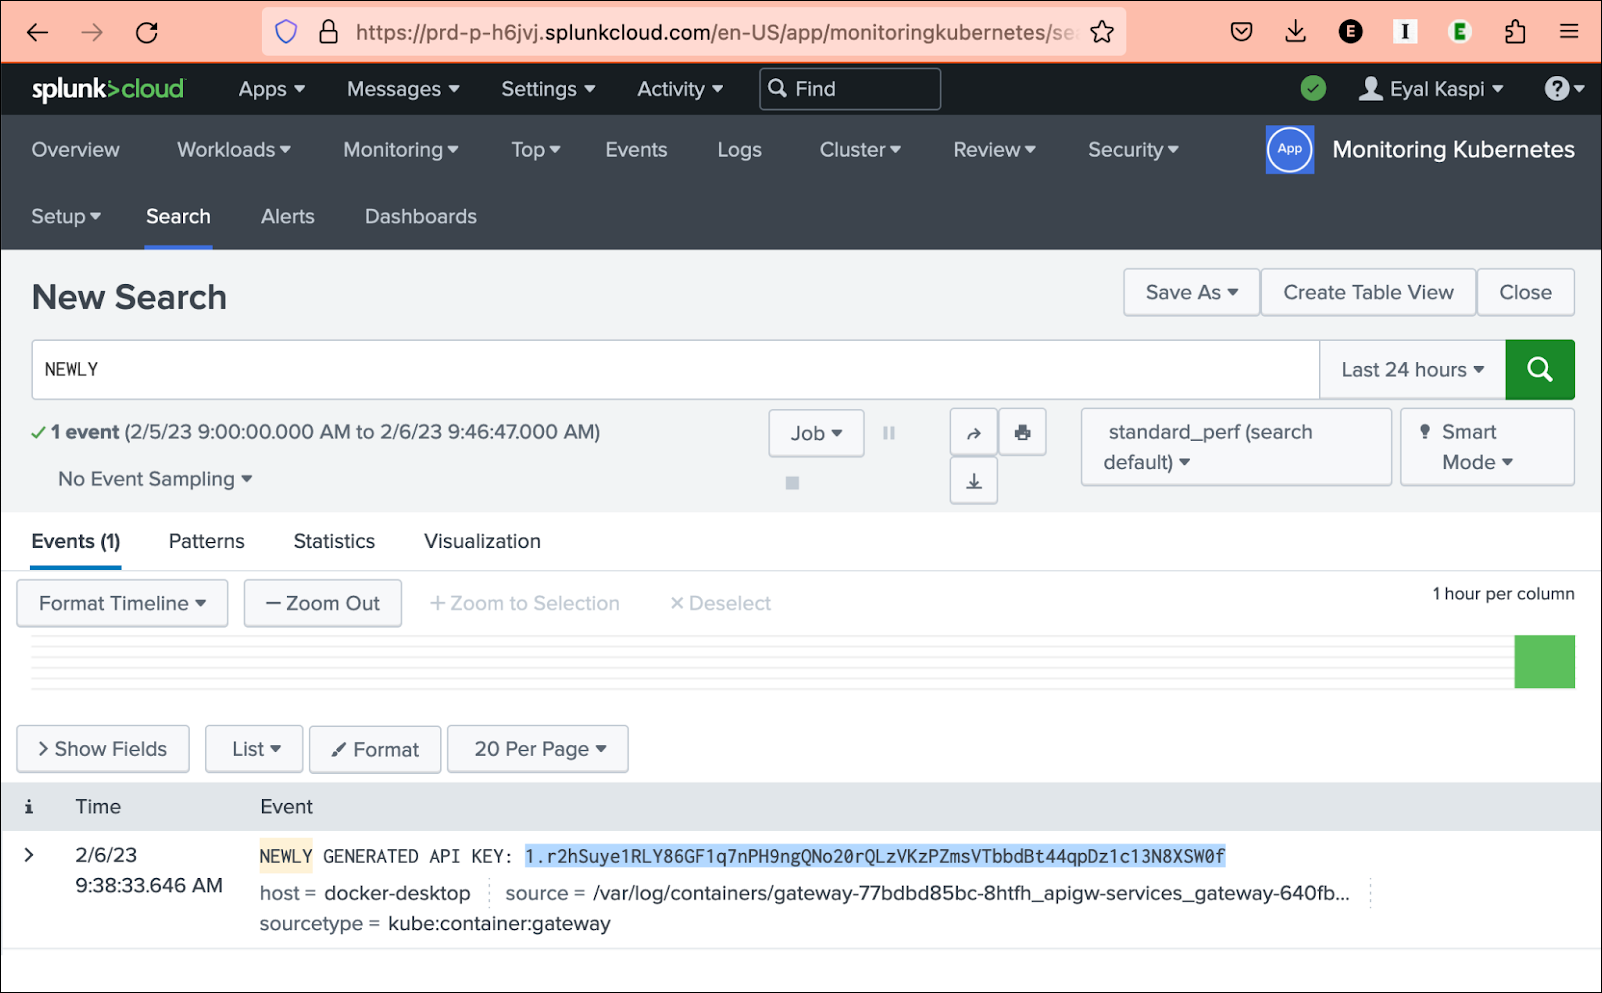
In the Splunk Cloud UI, via the “Monitoring Kubernetes” App, you can “search” for data sent by Kubernetes, as exemplified in the screenshot below. The bootstrap API key can be found as shown.
The example screenshot below shows a search for \”nginx\”, with use of the “extract new fields” wizard on the bottom left, which has Splunk parse the Nginx access logs. A regexp is used to name some of the fields like ipaddress, endpoint, accountid, etc. The example runs a search to return API requests associated with accountid.