
Data Risk report
Data Control Tower (DCT) version 16.0.0 and above introduces the Data Risk report, offering an in-depth view of your organization's data security posture by presenting global visibility metrics aggregated across all data connections of every connected Continuous Compliance Engine. This is crucial for identifying and mitigating potential data risks in sensitive data.
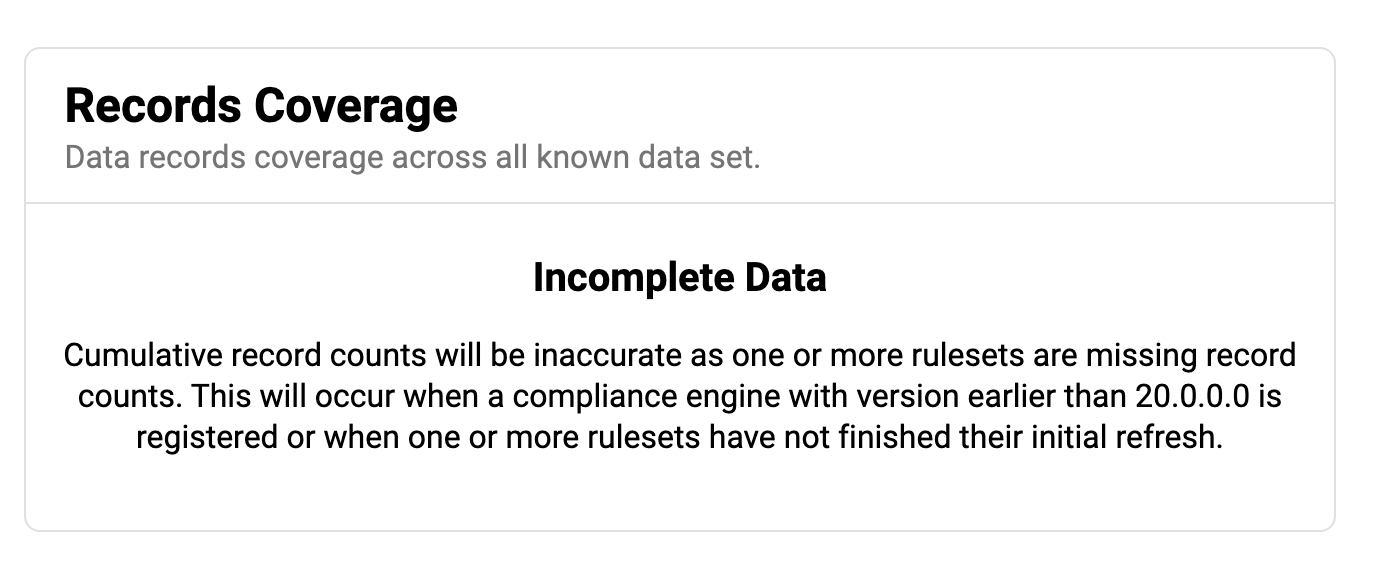
While the DCT version must be 16.0.0 or above, the Continuous Compliance Engine enhancements from version 20.0.0.0 and above are required to obtain database record counts by connectors. Thus, connected Continuous Compliance Engines with versions prior to 20.0.0.0 will not display record counts, and a warning message will replace the Records Coverage chart.
Currently, the report only includes database connectors. File and mainframe dataset connectors are not covered and will not appear in the report's UI table.
Feature list
Global visibility metrics
At the heart of the report are the global visibility metrics, presented through a combination of billboards and charts at the top of the page:Billboards: Show data connection counts across five categories.
Total number of data connections
Data connections with at least one successful profiling job
Data connections identified with sensitive data
Data connections with at least one successful masking job
Data connections at risk (sensitive but not masked)
Detailed data insights
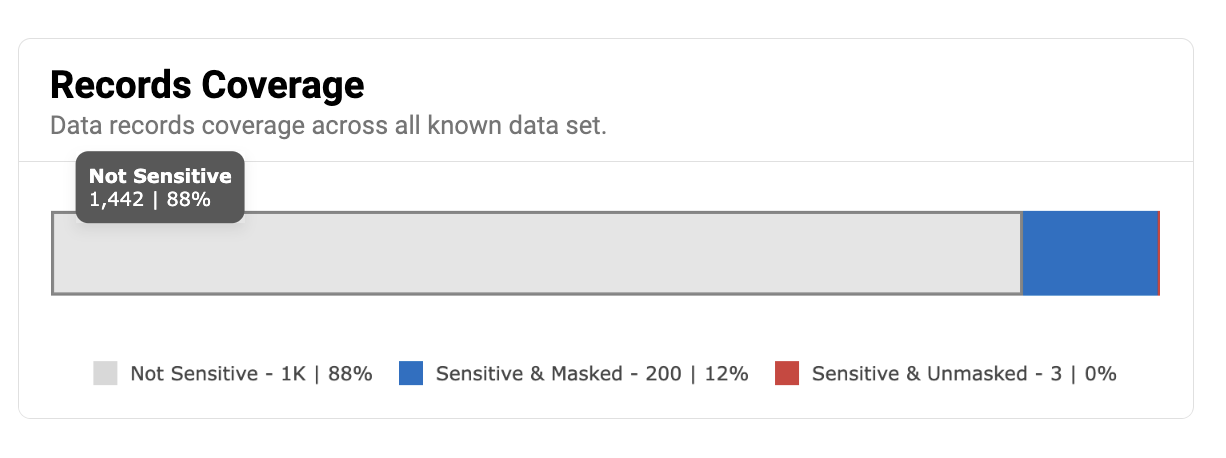
Charts: Offer insights into the count of data elements (e.g., database columns) and records in three categories, listed below. Legends and tooltips provide exact counts and percentages for each category, enhancing the understanding of your data's sensitivity and protection status.
Not sensitive
Sensitive and masked
Sensitive and unmasked
Report Scheduling
A new report type,
DATA_RISK_SUMMARY, has been added to the Reporting Schedule. This allows users to schedule regular updates on data risk metrics via email, at predefined intervals, to allow continuous monitoring and timely risk assessment.
GUI additions
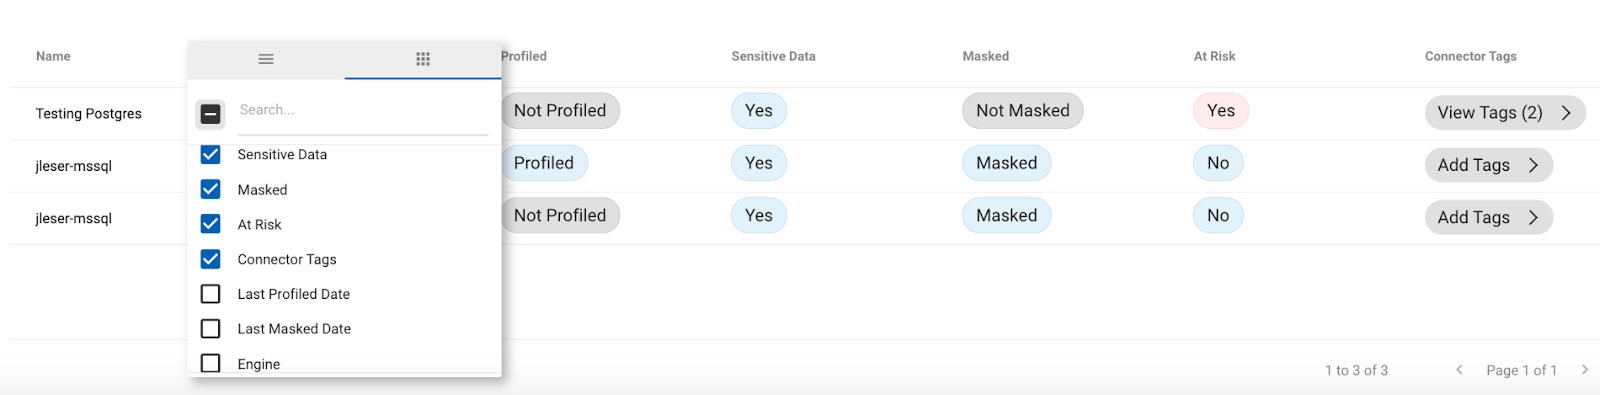
Below the charts, a table presents detailed data risk metrics for each data connection. Users can customize this table by toggling additional fields on or off through the column menu, for more relevant data insights.
The report also supports exporting of information in both CSV and JSON formats. This includes both global metrics and per-connection metrics for in-depth data analysis and reporting.
Terminology and definitions
To help provide clarity and understand the definitions for key terms used within this report, refer to the definitions below.
Is profiled: A connector has undergone a profiling job.
Is sensitive data: Sensitive data identified within a connector's data elements.
Is masked: A successful masking job has been run on the connector's data.
Is at risk: Sensitive data within a connector that has not been masked.
This is applied to data classified as sensitive (with at least one algorithm assignment), that has not had a successful masking job run. This definition is based on the masking job’s perspective.
Please note that data might be refreshed, potentially mislabeling it as not at risk despite changes in the actual data. This discrepancy arises as DCT may not detect that the underlying data has been updated, leading to potential inaccuracies.
Data elements total: The total count of data elements associated with a connector's data.
Records total: The total number of records detected for a connector's data.
Sensitive and unmasked: Data elements or records that are sensitive but have not been masked.