Insight reports
Activity Audit Log summary
The Activity Audit Log Summary provides a high-level audit log summary capturing the utilization of DCT by displaying user activity and the historical count of actions executed within the platform. This concise report enables stakeholders to quickly identify trends, monitor user engagement, and assess the overall effectiveness of data governance processes.
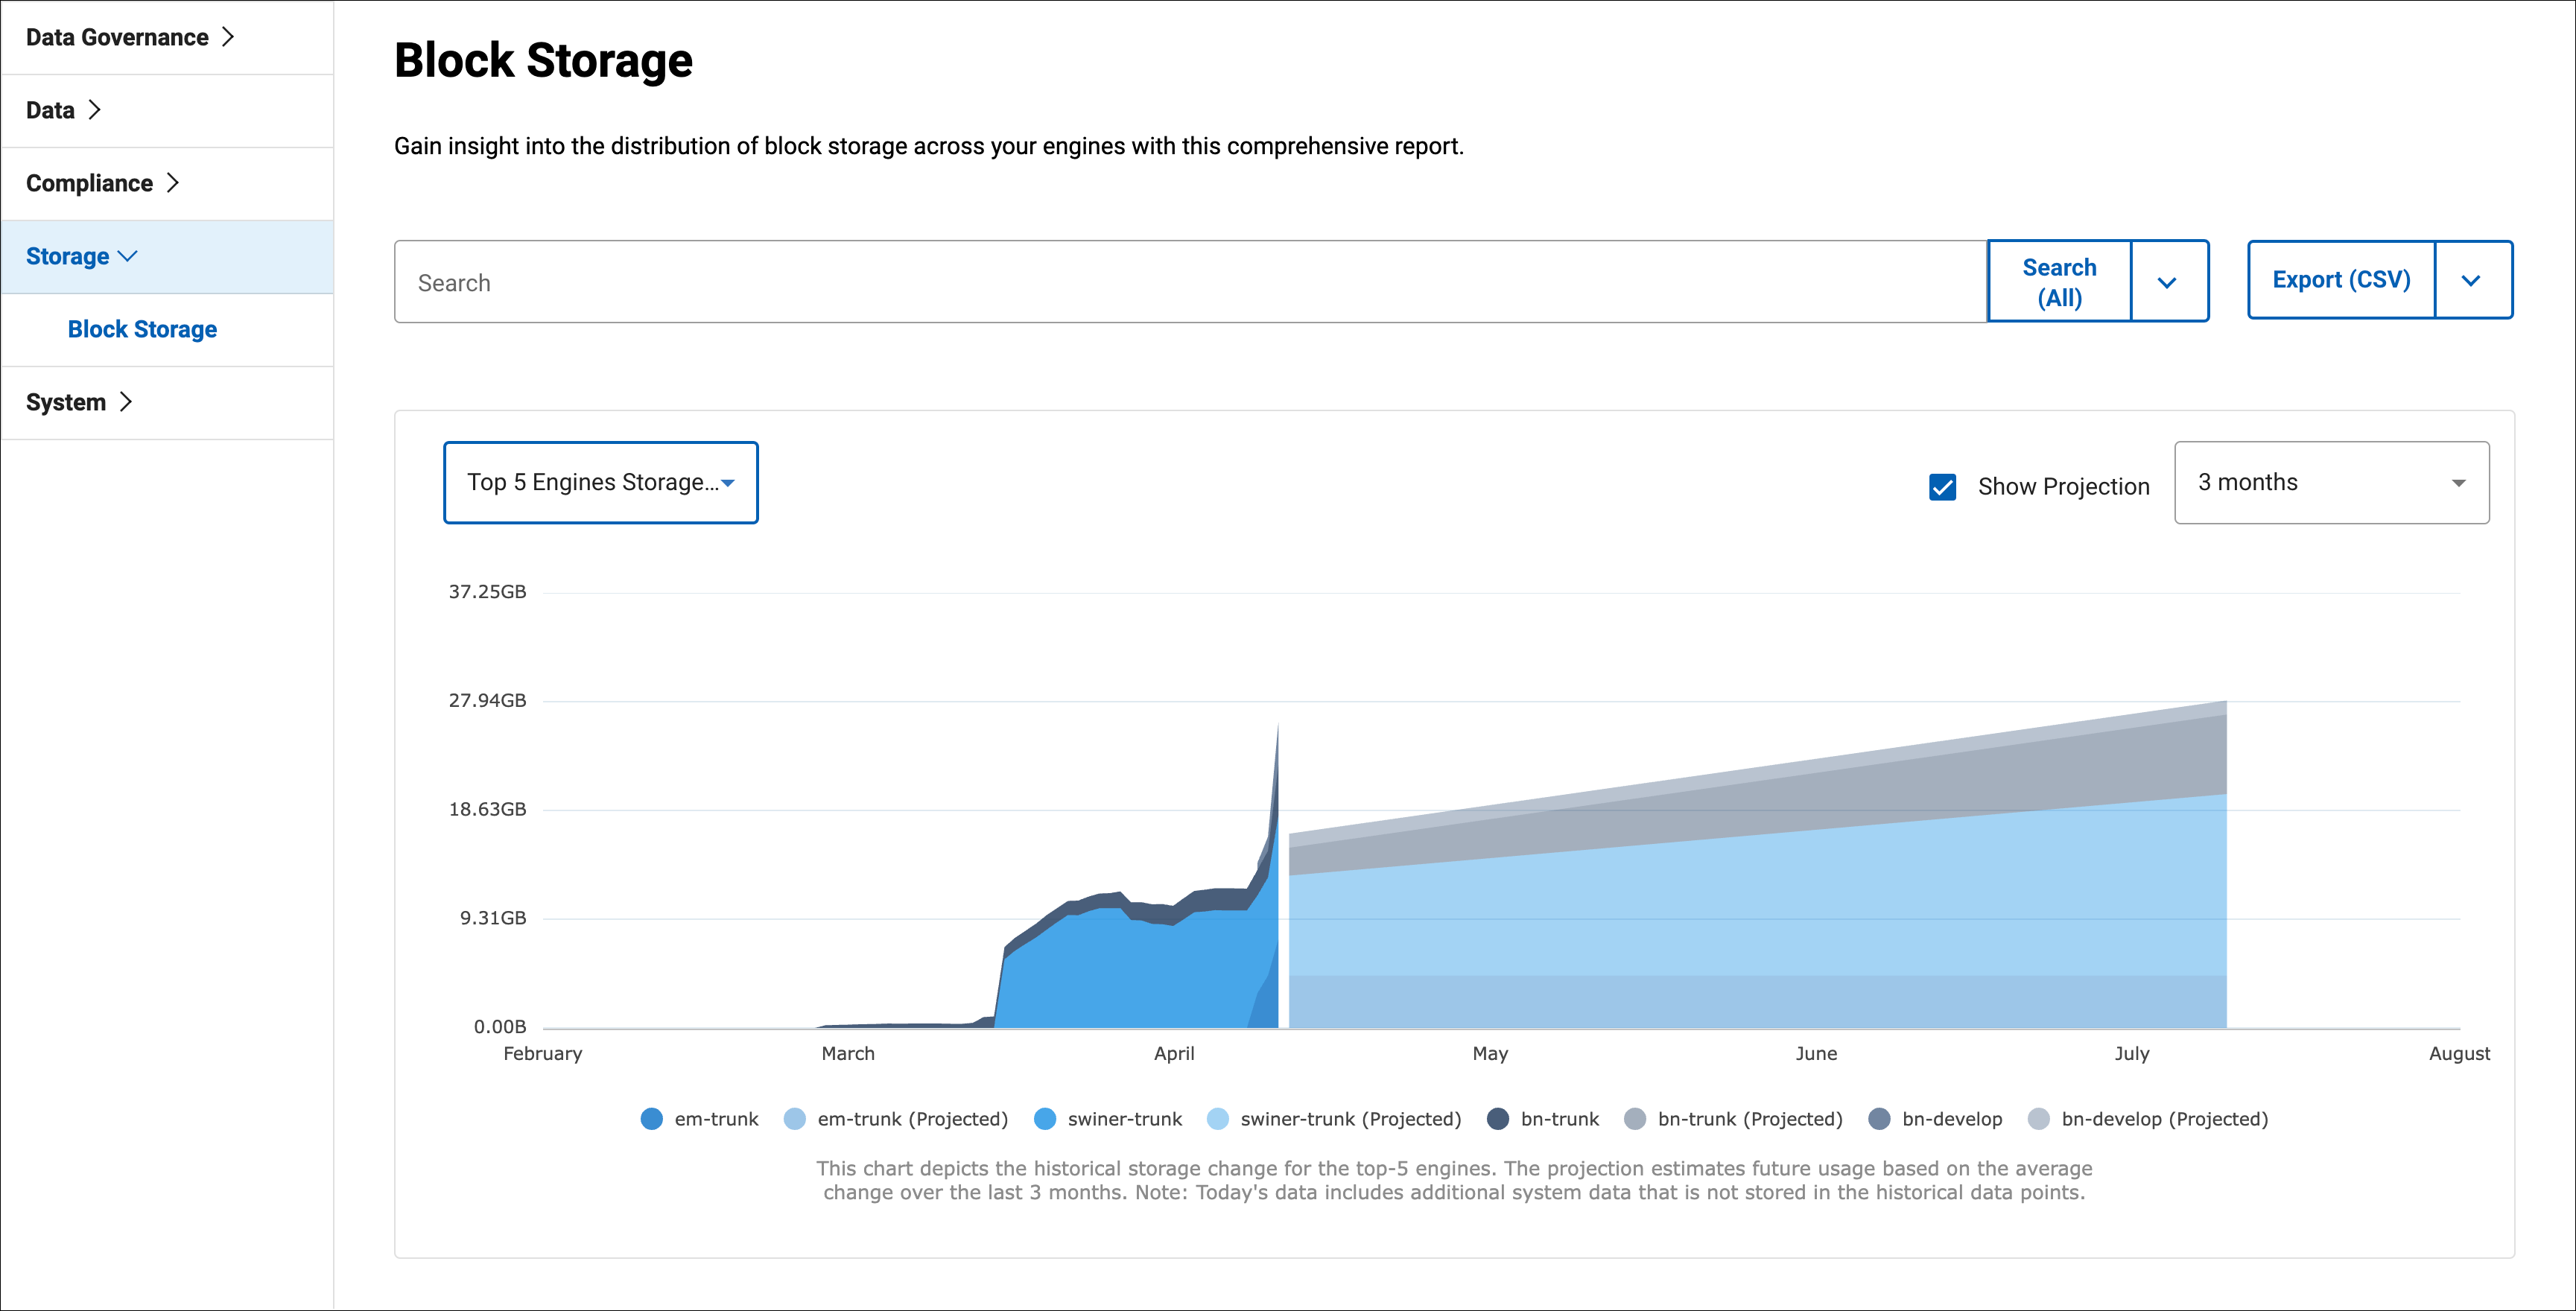
Block Storage report
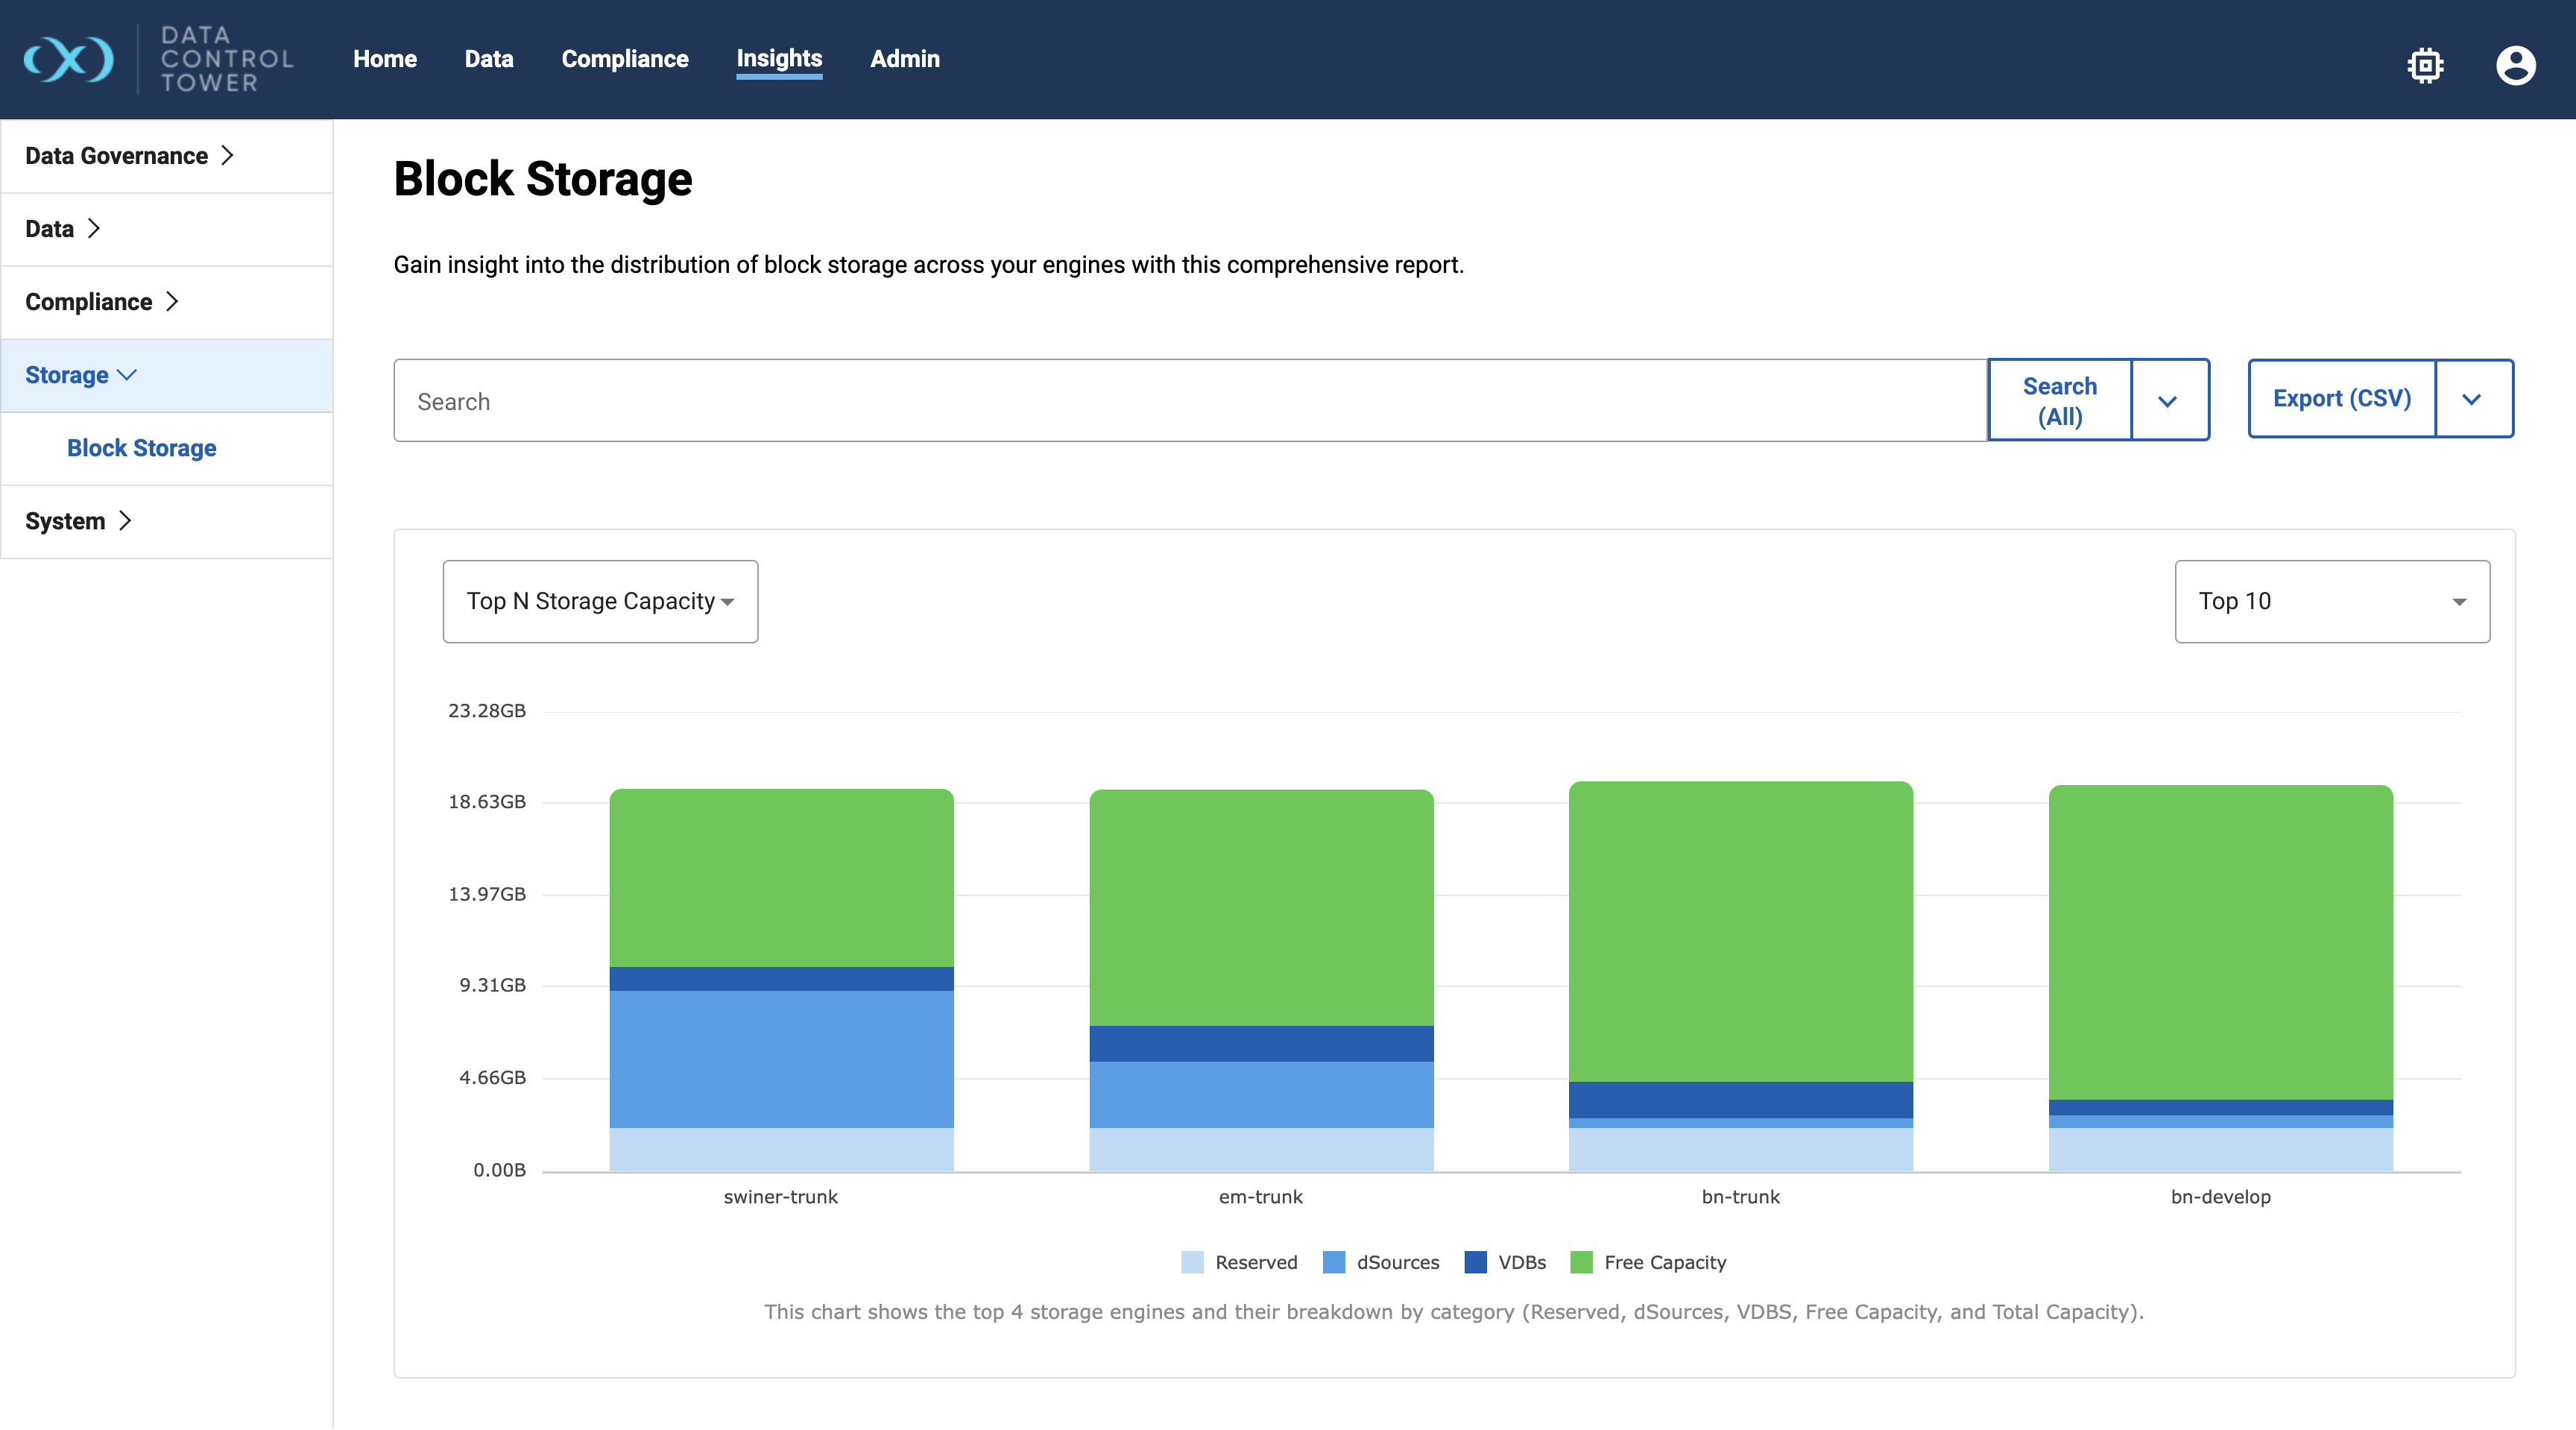
This report provides users with a comprehensive view of storage usage across different engines. With this report, users can easily identify the engines that are utilizing the most storage and take necessary action to optimize storage usage.
In addition, there are three distinct charts to help better understand storage usage across engines. The search can be utilized in order to filter out engines. All three charts only include data for engines that match the search criteria. They are exemplified below.
Top N Storage Capacity chart: Shows a breakdown of the current storage usage across the top 10 or 15 largest engines.
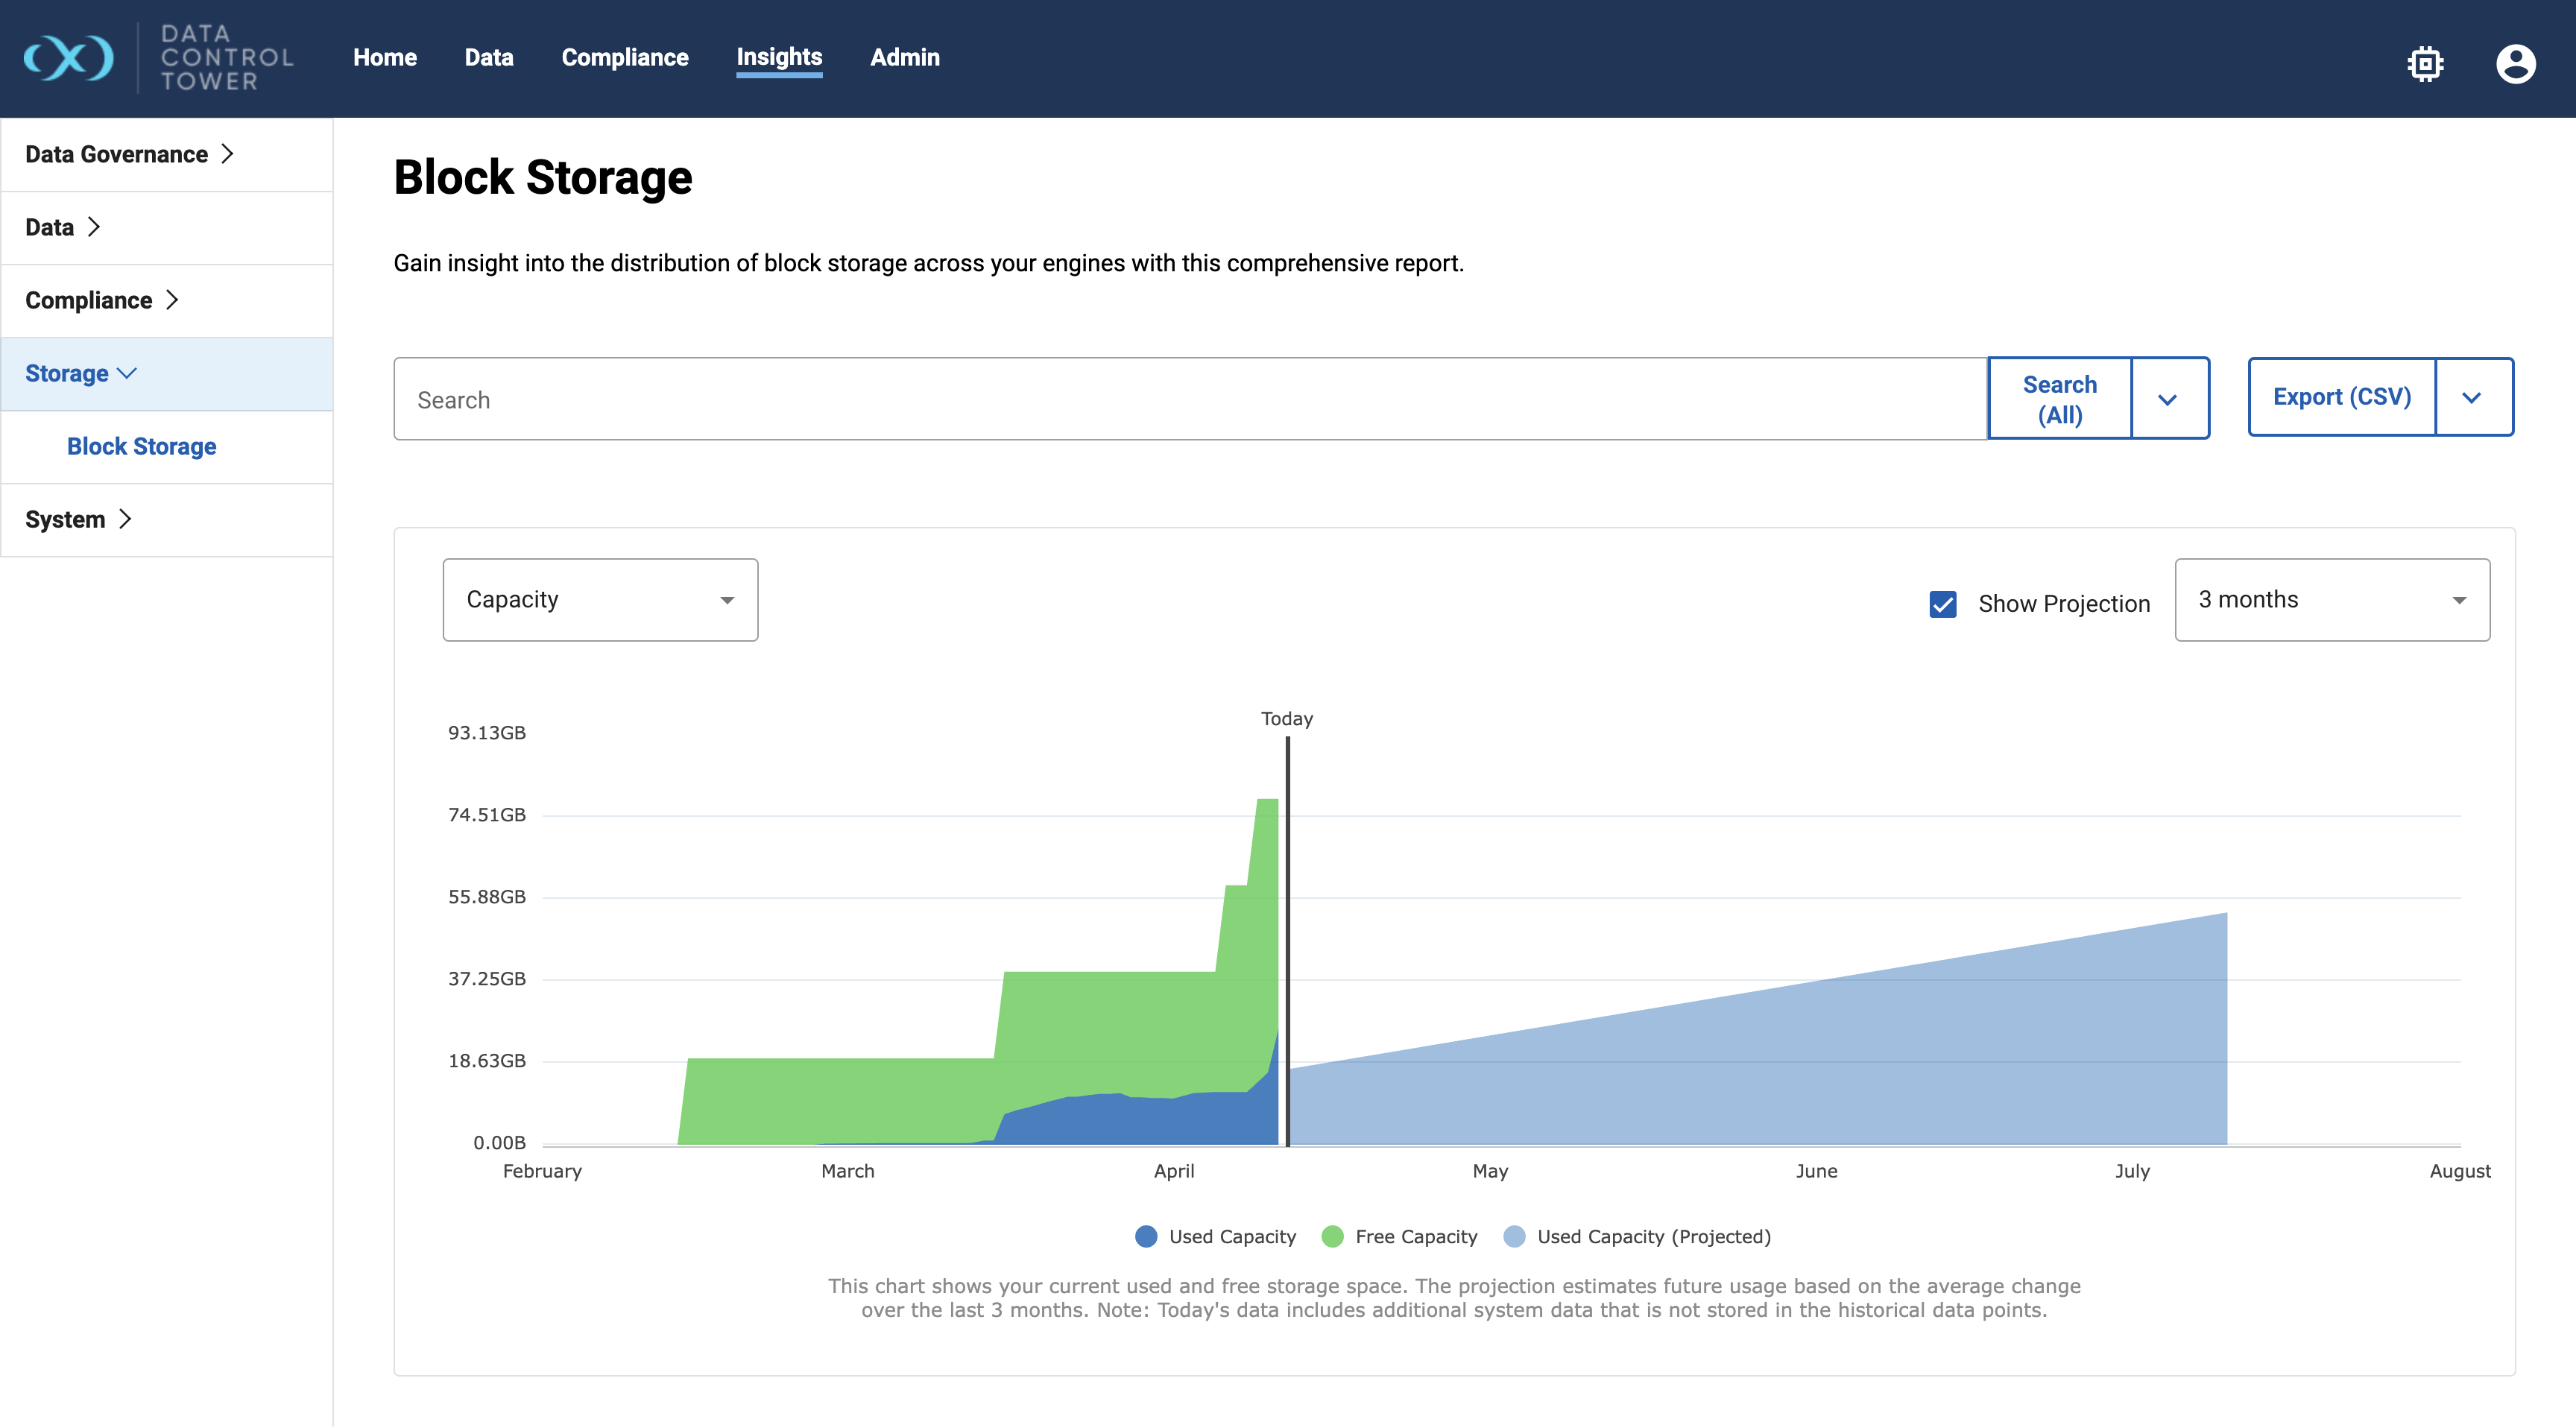
Capacity chart: Shows the historical storage usage and free space across all engines. This chart shows data for the past 3 or 6 month and supports an optional projection of used capacity for that same timeframe.
Data for the current day (UTC time zone) includes additional system data that is not taken into account for the historical data points.
Top 5 Engines Storage Usage chart: Shows the historical usage capacity for the 5 largest engines. This chart also shows data for the past 3 or 6 month with an optional projection of used capacity.
Data for the current day (UTC time zone) includes additional system data that is not taken into account for the historical data points.
Central Governance insights
DCT provides global reporting of real-time statuses. This section will break down all of the reports in the Insights section of DCT.
All insight dashboards can be exported to CSV or JSON format.
Compliance Job Executions report
The Compliance Job Executions Report dashboard offers a comprehensive overview of the compliance jobs executed within DCT, by presenting key metrics that enable stakeholders to assess the efficiency and effectiveness of their data governance efforts.
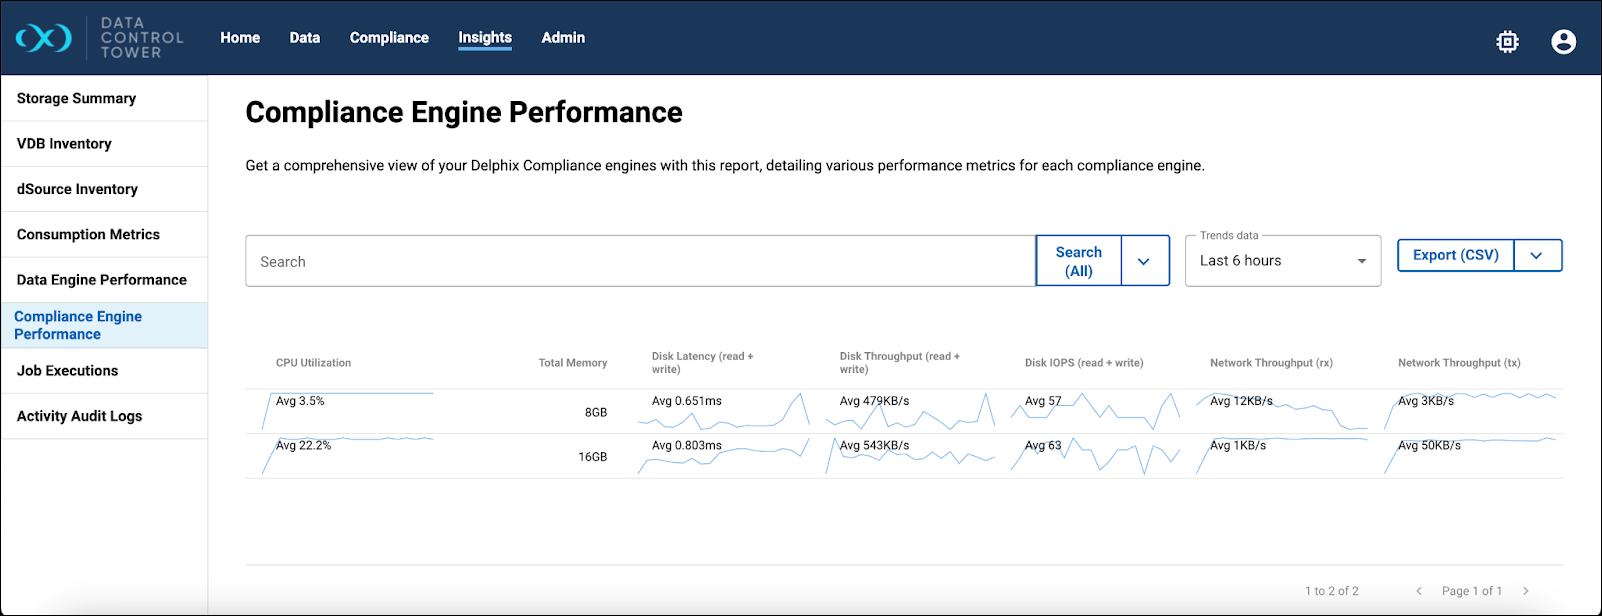
Continuous Compliance Engine Performance report
The Engine Performance dashboard provides users with a comprehensive view of performance information for Delphix Continuous Compliance Engines. The performance metrics include system CPU utilization, system memory usage, latency and throughput details for Disk protocols, and network throughput.
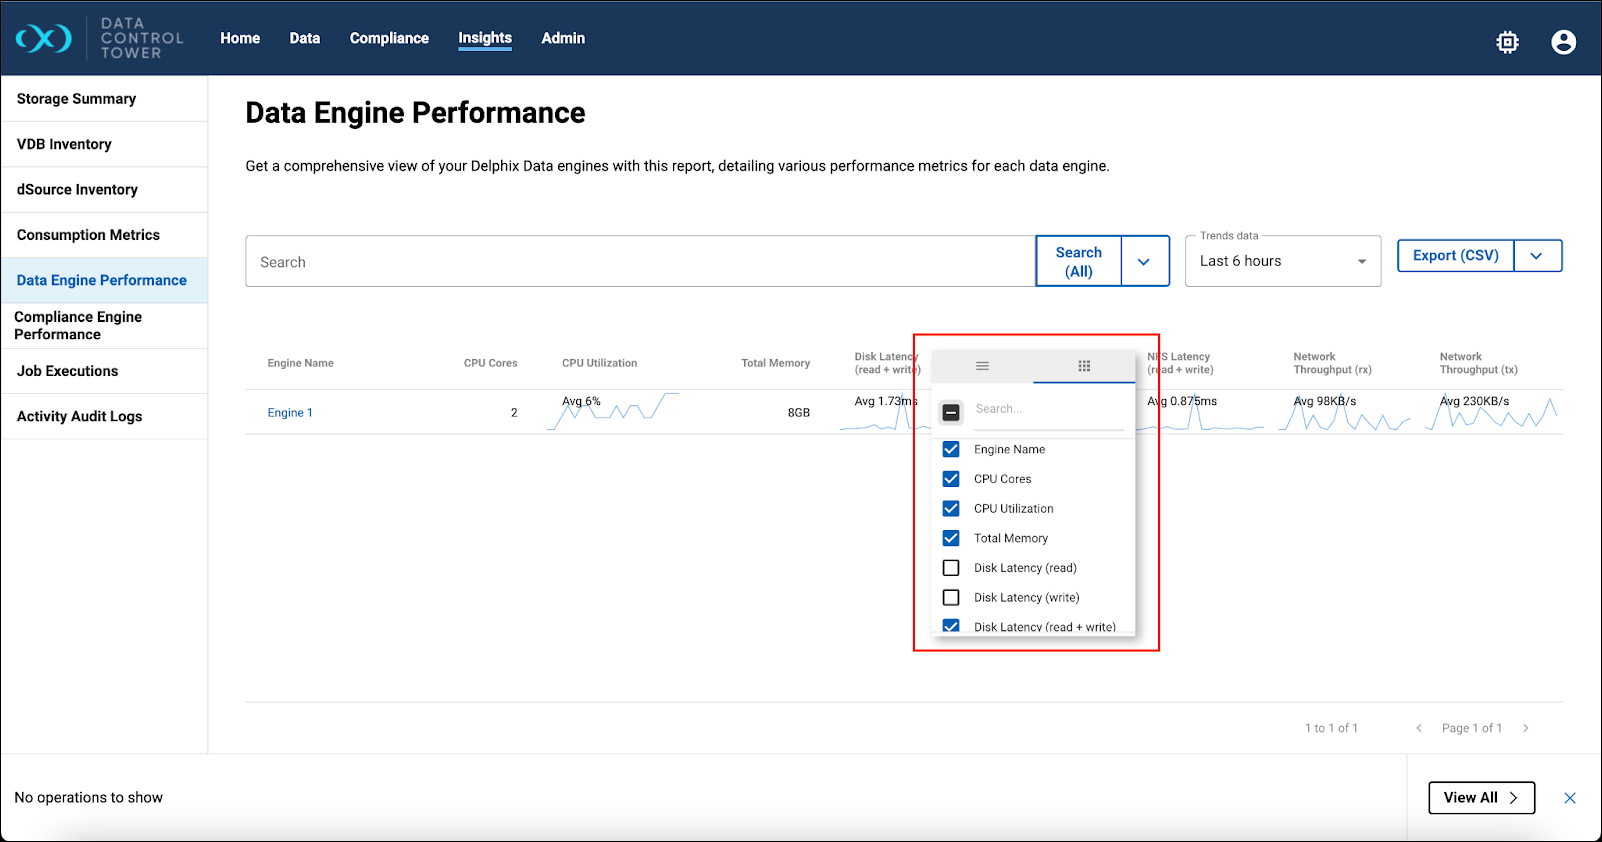
Continuous Data Engine Performance report
The Engine Performance dashboard provides users with a comprehensive view of performance information for Delphix Continuous Data Engines. The performance metrics include system CPU utilization, system memory usage, latency, IOPS, and network throughput details for Disk, NFS, and iSCSI protocols.
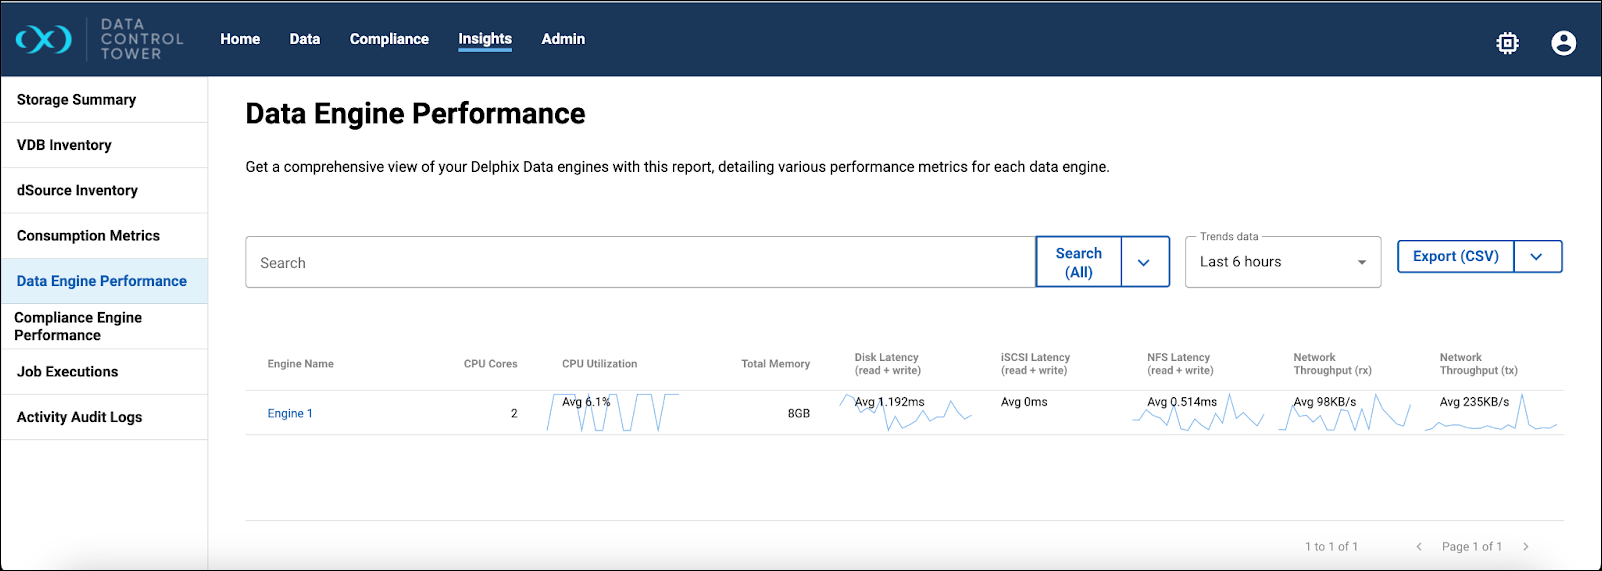
By default, a fix set of data columns are shown. Users have the flexibility to add or remove columns based on their preferences.
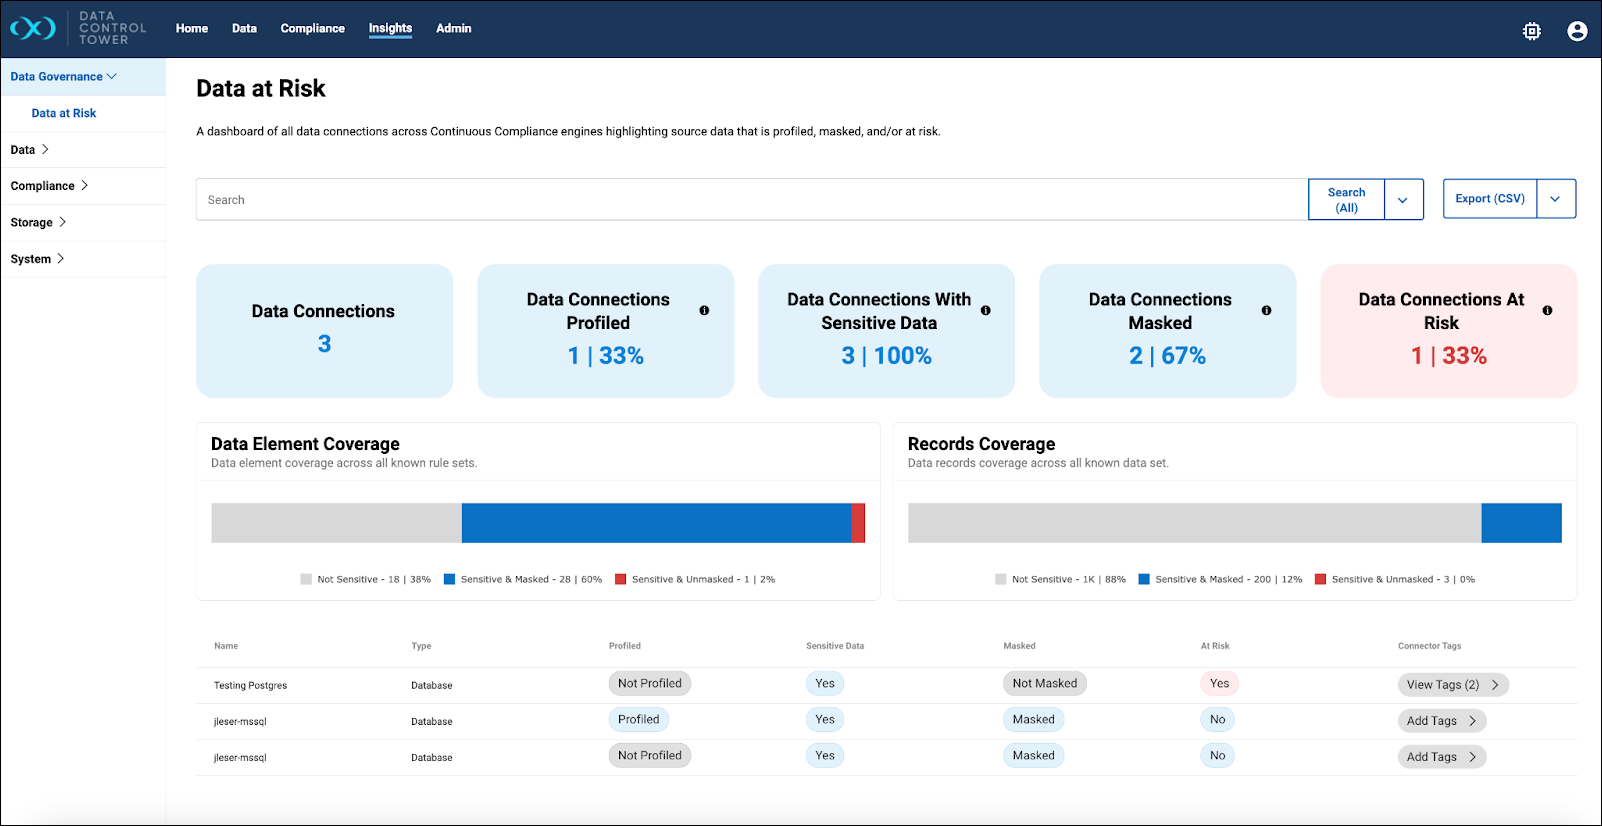
Data Risk report
The Data Risk report is available in DCT version 16.0.0 and above. It provides visibility into data risk across your organization by aggregating metrics and insights from all Continuous Compliance Engines, including their environments and jobs, to give governance stakeholders a global overview of potential risks in sensitive data. More information on this report can be found in the Data Risk report page.
dSource Inventory report
The dSource Inventory report provides users with a comprehensive list of all the dSources created in the DCT platform and their identification metadata.
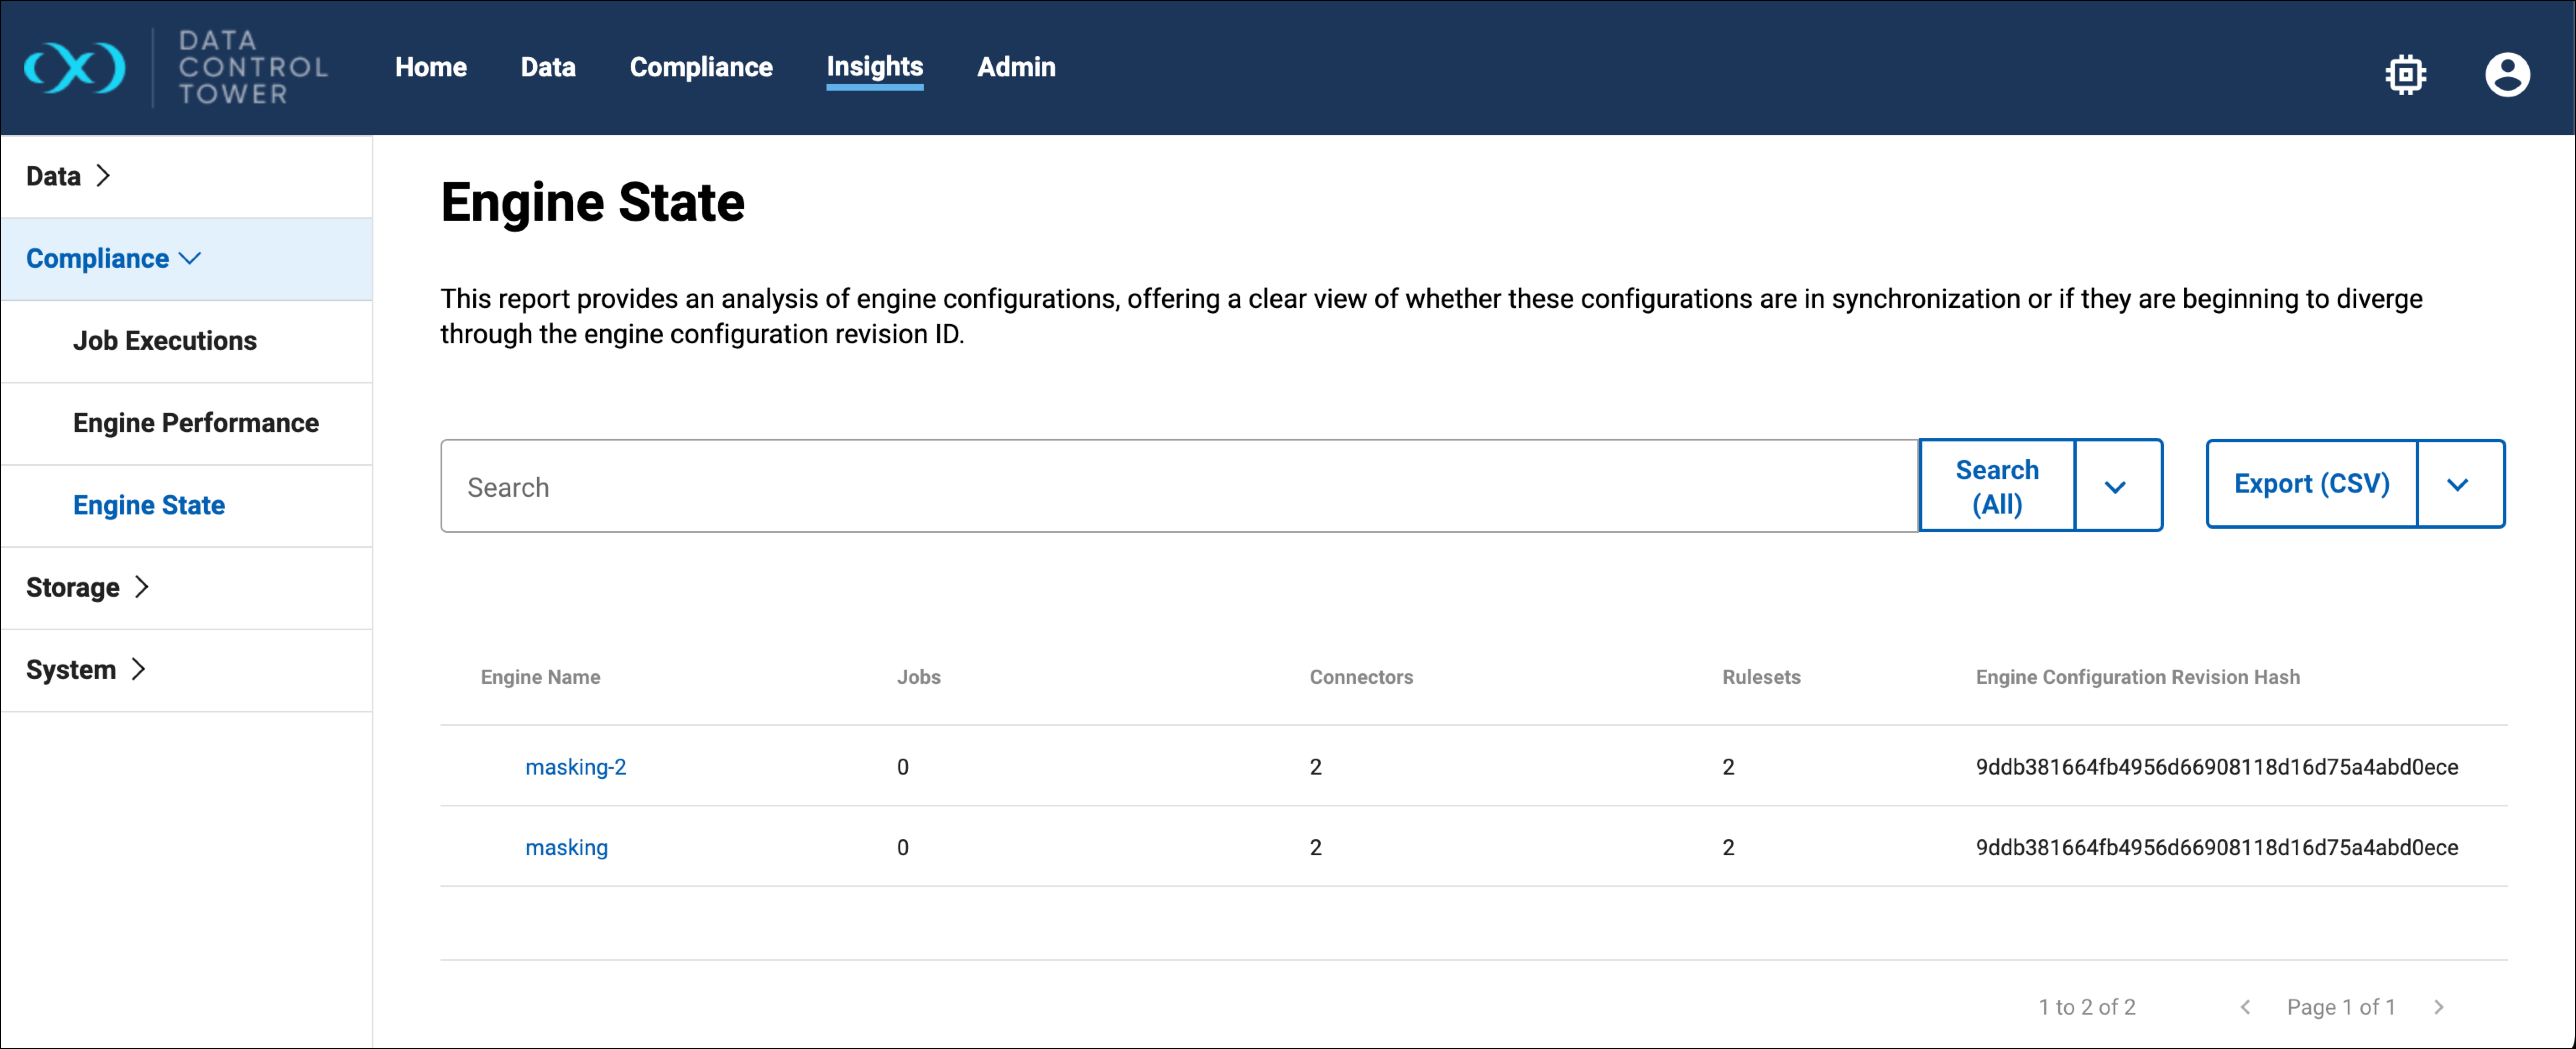
Global State report
The Compliance Engine (Global) State report provides the users with an overview of which engines are in sync and can be used to horizontally scale a compliance job. The users should use the Engine Configuration Revision Hash (Global Object Revision Hash) to determine if engines are synced – they have identical global object like (algorithms, rule sets, domains, etc.). Search filtering and sorting can be used to find all engines that are in-sync, and also determine if an engine has fallen out of sync. If the user wants to take action by then syncing an un-synced engine, they can do so from the Hyperscale Orchestrators' details page via the Manually Deploy Job Dependencies action menu.
Source Ingestion Metrics
The Data Source Ingestion Metrics dashboard is designed to help users find their virtualization source ingestion metrics, which are often required for contract renewal purposes. The dashboard contains the data sources and informs the user of the total size of that ingestion source.
Storage Savings report
The Storage savings report illustrates how Delphix is effectively reducing storage costs through the implementation of data virtualization. The data in the table shows space metrics for each dSource and its child/descendant VDBs. The tiles above show the aggregates across all the pages of the table. The tiles will update to reflect the results in the table as the result of any search filtering.
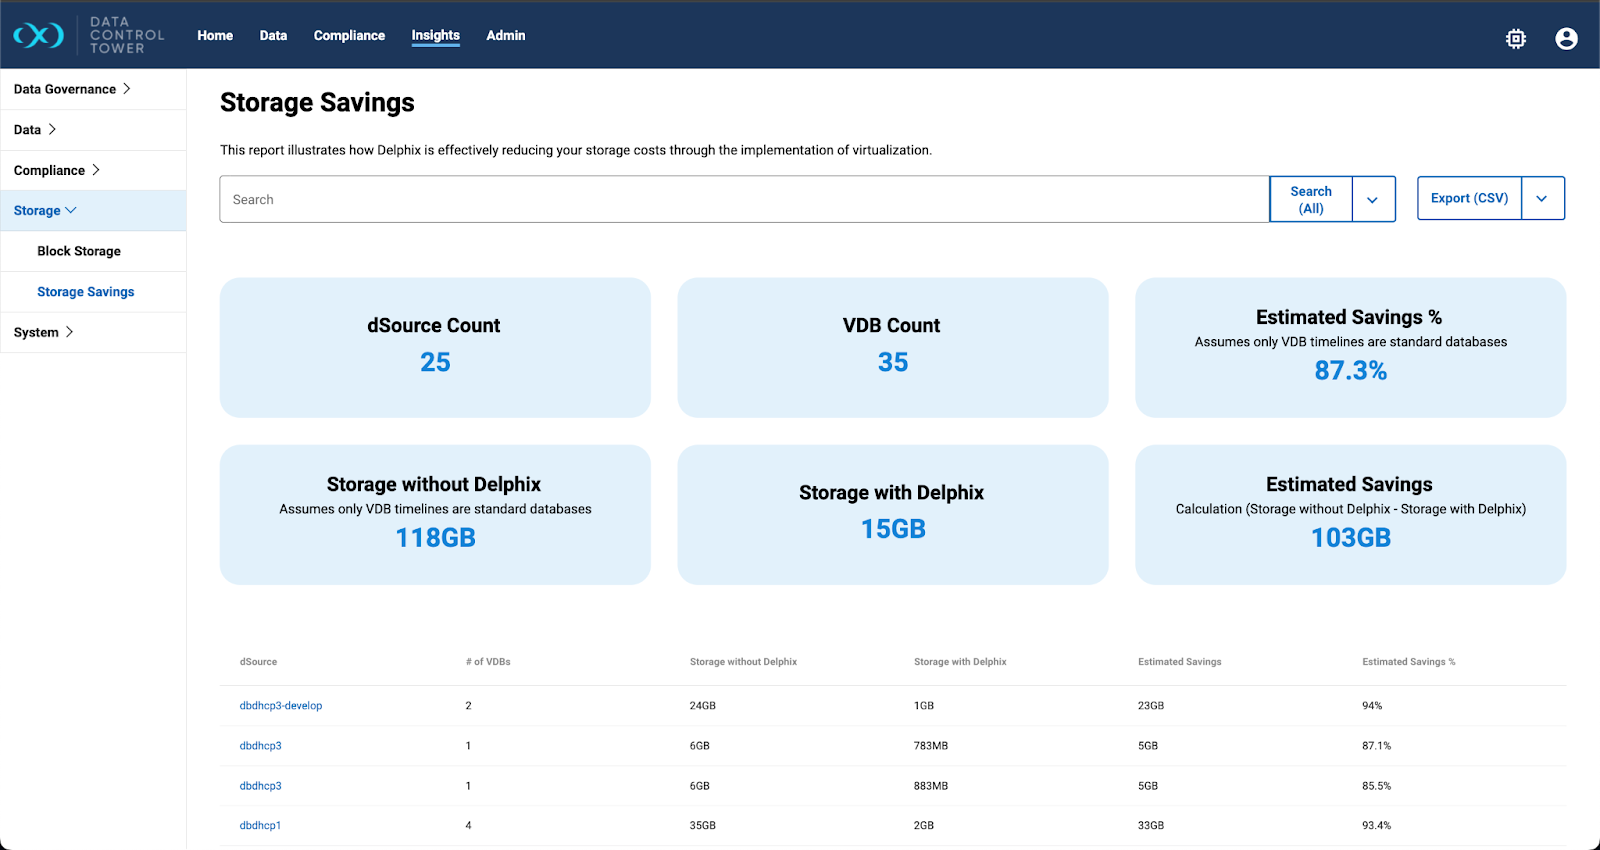
Savings are reported as the storage you would need without Delphix versus the storage Delphix is using for those same objects. The difference between the two is then used to show the savings and savings percentages.
Delphix's dataset timeflows/timelines enable users to navigate through different data states at various time points, mimicking having multiple dataset copies, thus offering significant storage savings. This functionality, known as "VDB Refresh," is typically external, requiring separate data copies. Users interested in the storage Delphix saves for only the current data state can toggle the current active timeline columns.
These current active timeline metrics are available on engine versions 22.0.0.0 or later. Columns for these metrics are hidden by default if any dSources come from older engines but will appear when all dSources are from compatible newer engines. Although the default view focuses on the current active timeflow, metrics for all timeflows remain accessible via the column menu for users needing broader data insights.
VDB Inventory report
The VDB Inventory report provides users with a comprehensive list of all the Virtual Databases (VDBs) created in the DCT platform and their identification metadata.
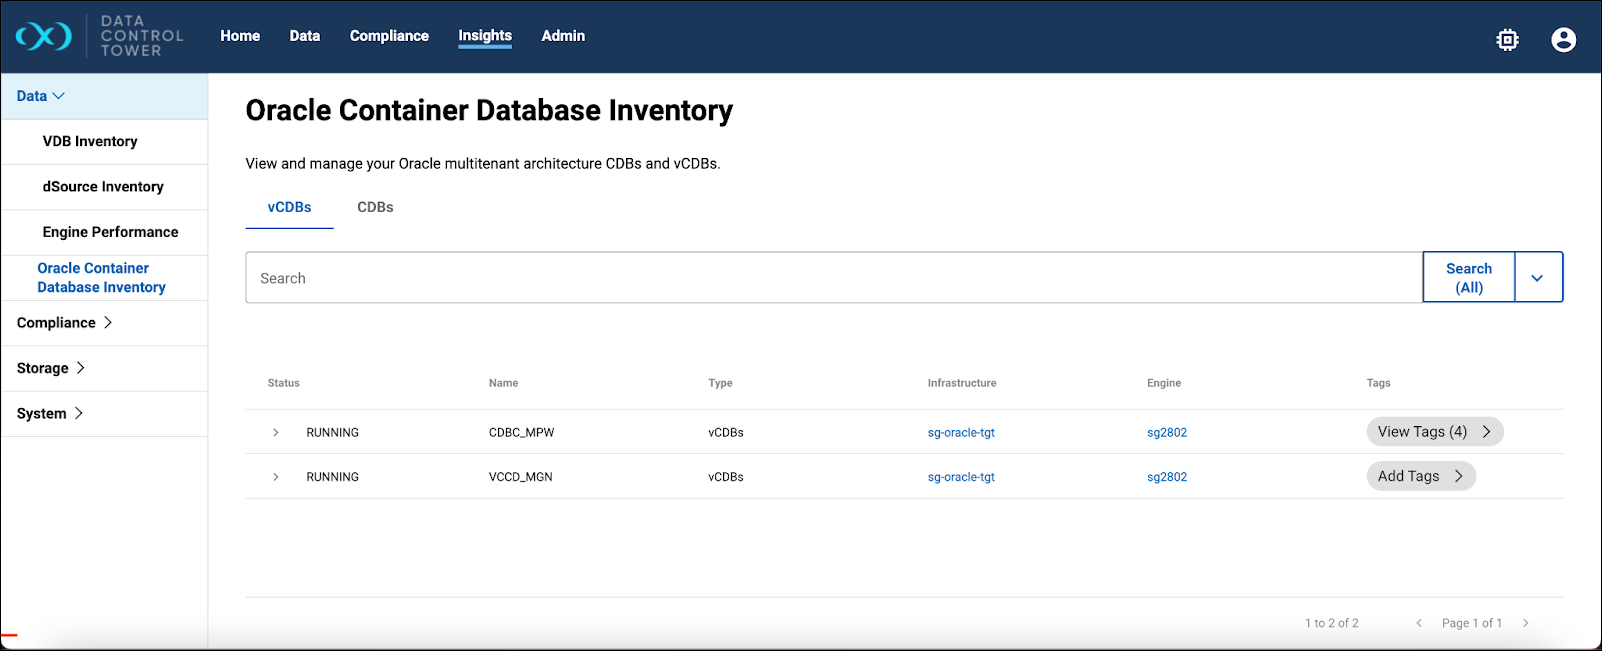
Oracle Container Database Inventory report
This report provides a comprehensive list of all Container Databases (CDBs) and virtual Container Databases (vCDBs). This report features an expandable list that reveals pluggable data associated with each CDB or vCDB, providing in-depth visibility into your Oracle database environment at a glance.